Example of an exam assignment
The slides below show you what you can expect on an exam based on the material of the past weeks.
Please note that:
- these examples exaggerated the complexity of the exam.
Definition question
Answer two questions from the list below:
What measures of central tendency are most commonly applied in social sciences?
What are extreme observations or outliers?
What effect do outliers/extreme observations have on the mean/median, standard deviation/IQR?
Is the median one of the quantiles or is it a measure of central tendency?
What is the Hypothesis Testing?
Descriptive analysis (1)
Continuous variables
| yield |
60 |
0 |
5.4 |
1.1 |
3.1 |
5.4 |
7.9 |
| nitrogen |
52 |
0 |
77.3 |
49.6 |
0.0 |
79.0 |
148.6 |
| potassium |
60 |
0 |
33.1 |
15.1 |
1.7 |
34.3 |
61.4 |
| phosphorus |
60 |
0 |
37.6 |
21.6 |
0.8 |
38.8 |
74.7 |
Categorical variables
| tech |
Minimum (control) |
30 |
50.0 |
|
Optimum (treatment) |
30 |
50.0 |
| variety |
V1 |
30 |
50.0 |
|
V2 |
30 |
50.0 |
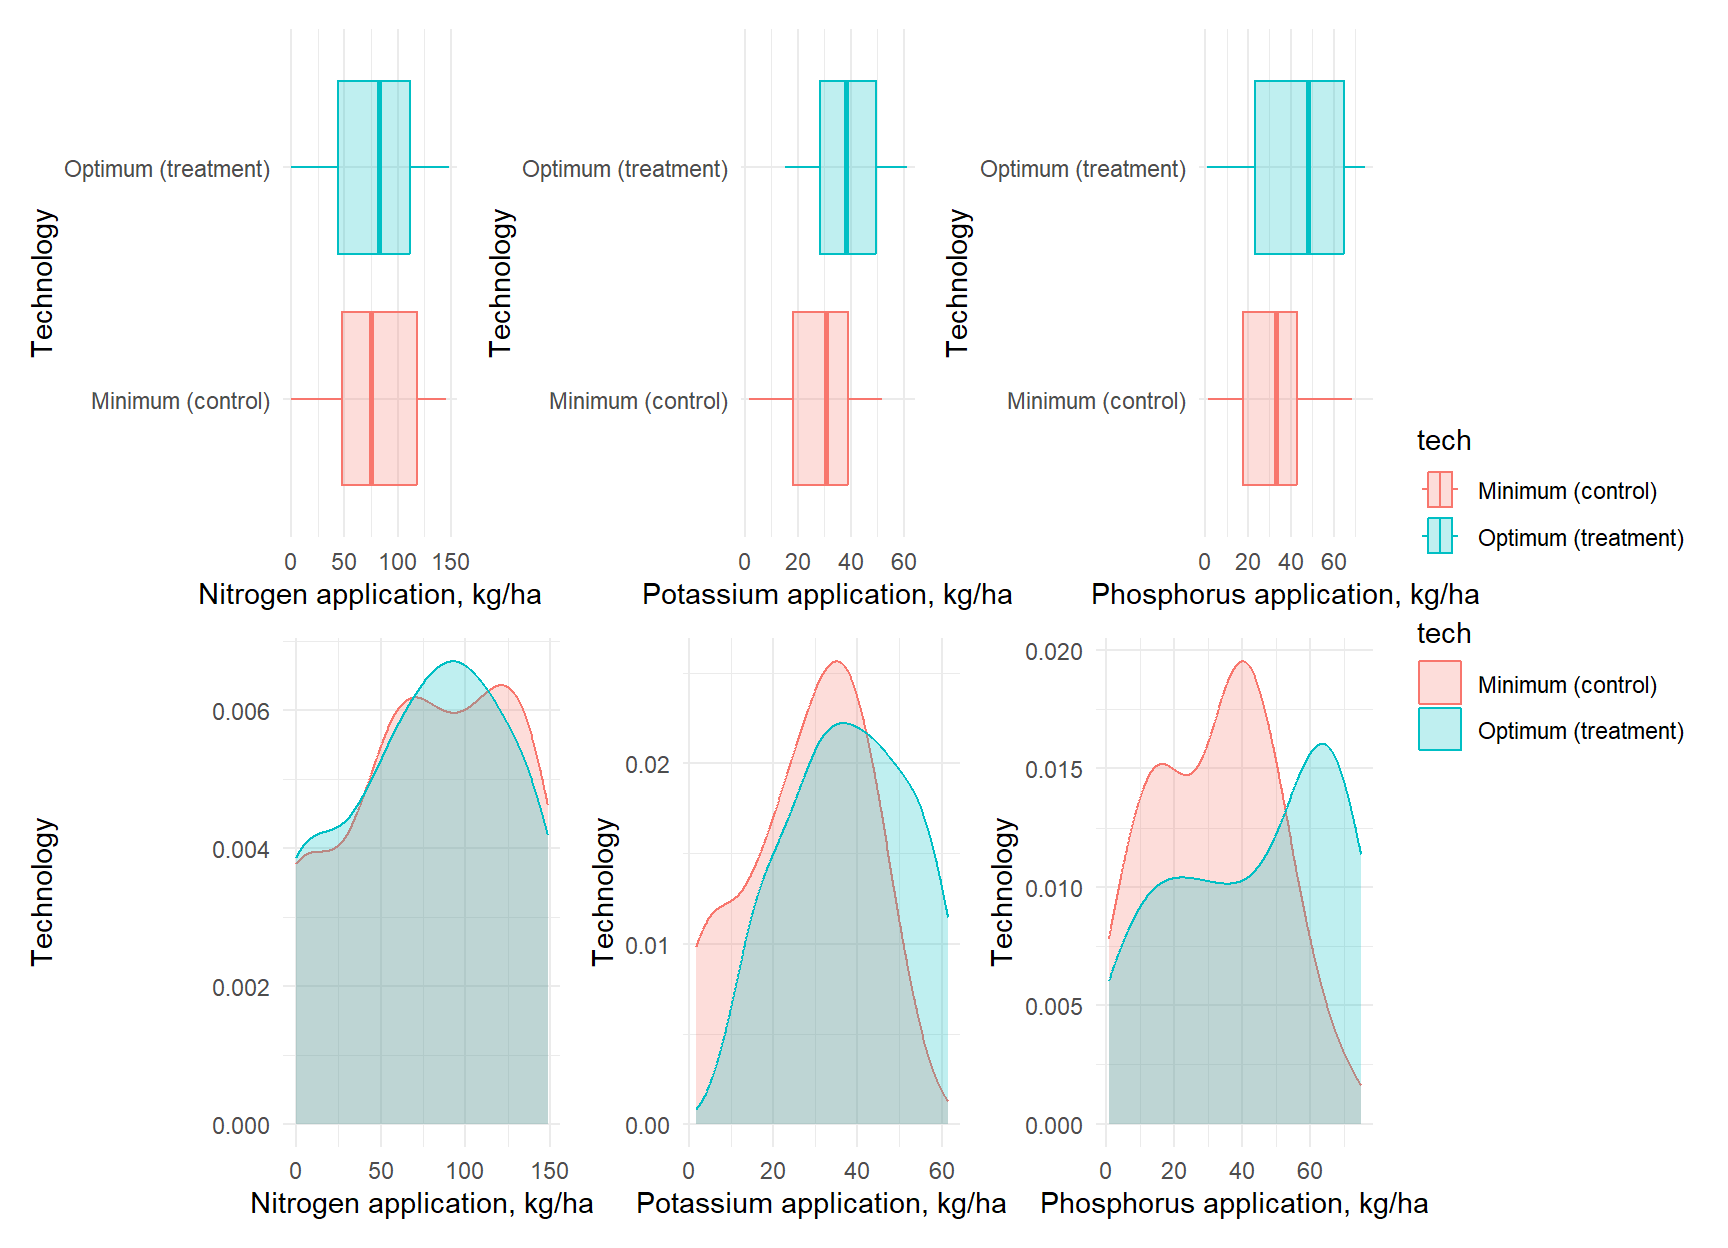
Checks and Balances (2)
|
Mean |
Std. Dev. |
Mean |
Std. Dev. |
| nitrogen |
77.7 |
50.4 |
76.9 |
49.7 |
| potassium |
28.0 |
14.4 |
38.2 |
14.2 |
| phosphorus |
31.7 |
17.9 |
43.4 |
23.7 |
Significance levels are: ‘+’=.1, ‘*’=.05, ‘**’=.01, ‘***’=0.001
Effect of technology on yields
Our key objective is to quantify the effect of technology on yields.
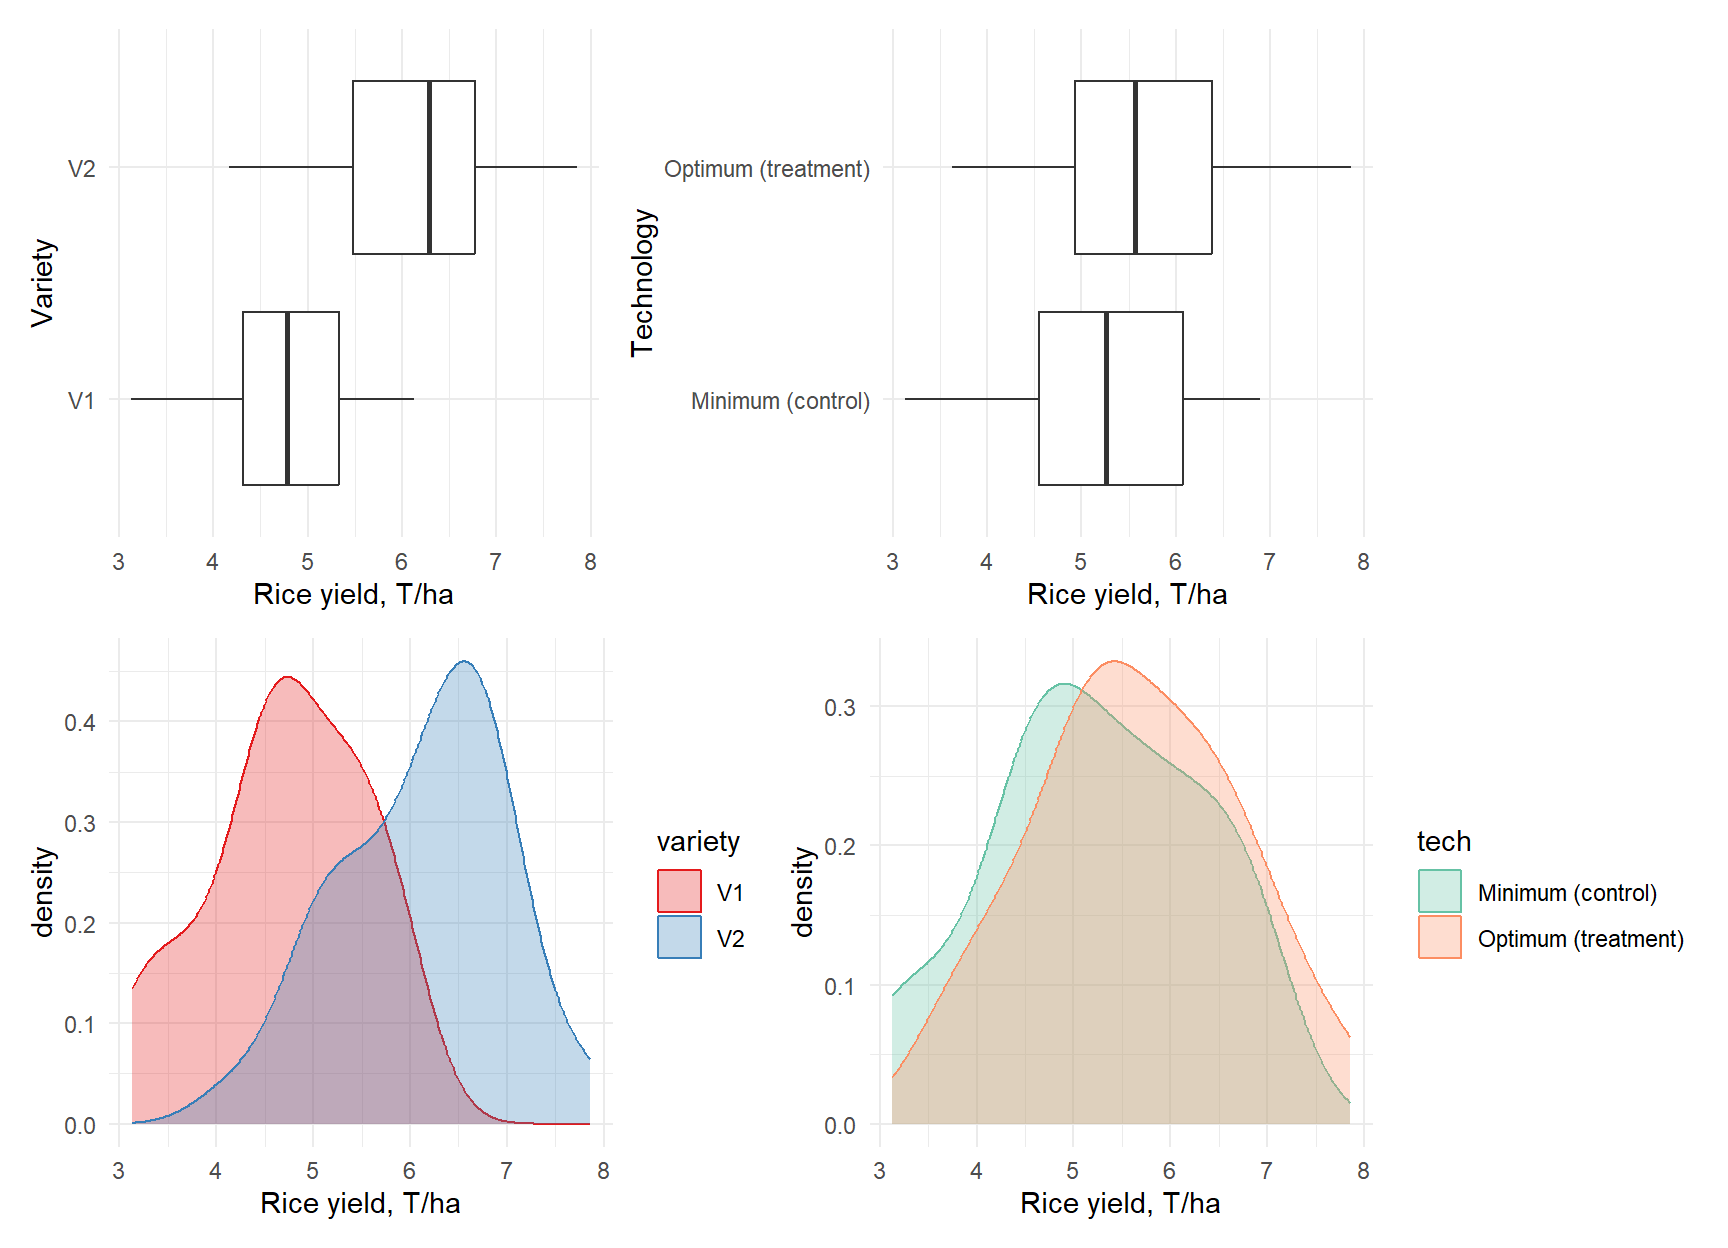
What differences do you observe between technologies in terms of rice yields?
Can we conclude about the causal effect of technologies based on this plot?
HT: effect of technology on yields
|
Mean |
Std. Dev. |
Mean |
Std. Dev. |
| yield |
5.2 |
1.1 |
5.6 |
1.1 |
Significance levels are: ‘+’=.1, ‘*’=.05, ‘**’=.01, ‘***’=0.001
Why do we need this HT?
Formulate H0 and H1.
Conclude about the effect of technology on yields.
What statistics did you use?
What is the highest level of significance for your results?
Conclude about the effect of technology on yields
Does the optimal technology have any causal effect on yields?
How large is this effect?
Does the RCT performed here ensures the ceteris paribus?
What else can influence the effect of technology on yield?
How can we control for it?
Differences in yields between varieties
What does this plot show?
Considering previous results, can we conclude about the quality of random assignment now?
Is there a causal effect of variety on yields, which effect is this?
HT: effect of variety on yields
|
Mean |
Std. Dev. |
Mean |
Std. Dev. |
| yield |
4.7 |
0.8 |
6.1 |
0.9 |
Significance levels are: ‘+’=.1, ‘*’=.05, ‘**’=.01, ‘***’=0.001
Formulate H0 and H1.
Conclude about the yield difference between varieties.
Based on our sample, can we conclude that variety has a causal effect on yields?
Does our sample ensure the ceteris paribus? How does our sample ensure it?
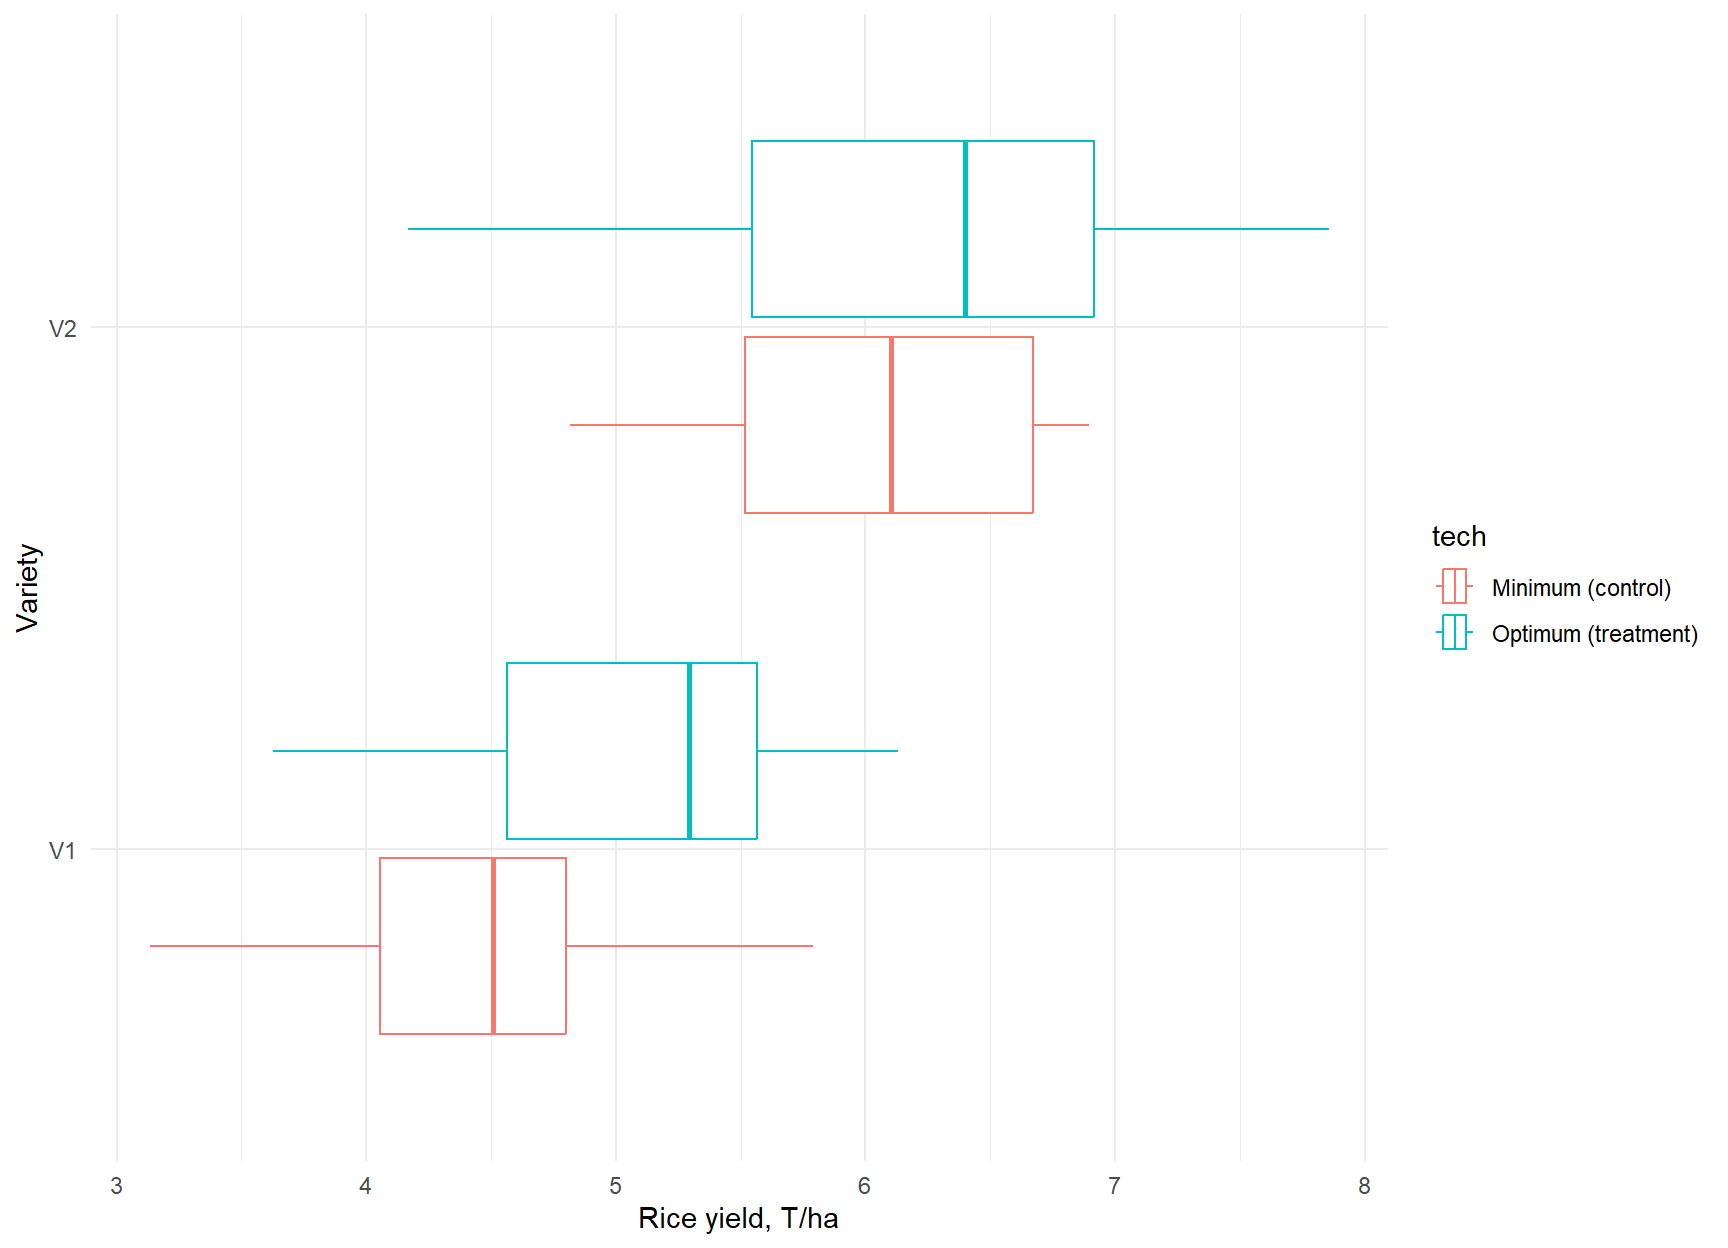
Conclude again
Does the random assignment of technology ensure the ceteris paribus here?
What are the most relevant other factors that may influence the ceteris paribus in our sample?
Given that what can we conclude about the causal effect of technology on yields?
After today’s lecture you should be able to answer the following:
Can we “control” the effects of the other factors?
What econometric method can we use to re-establish the ceteris paribus?
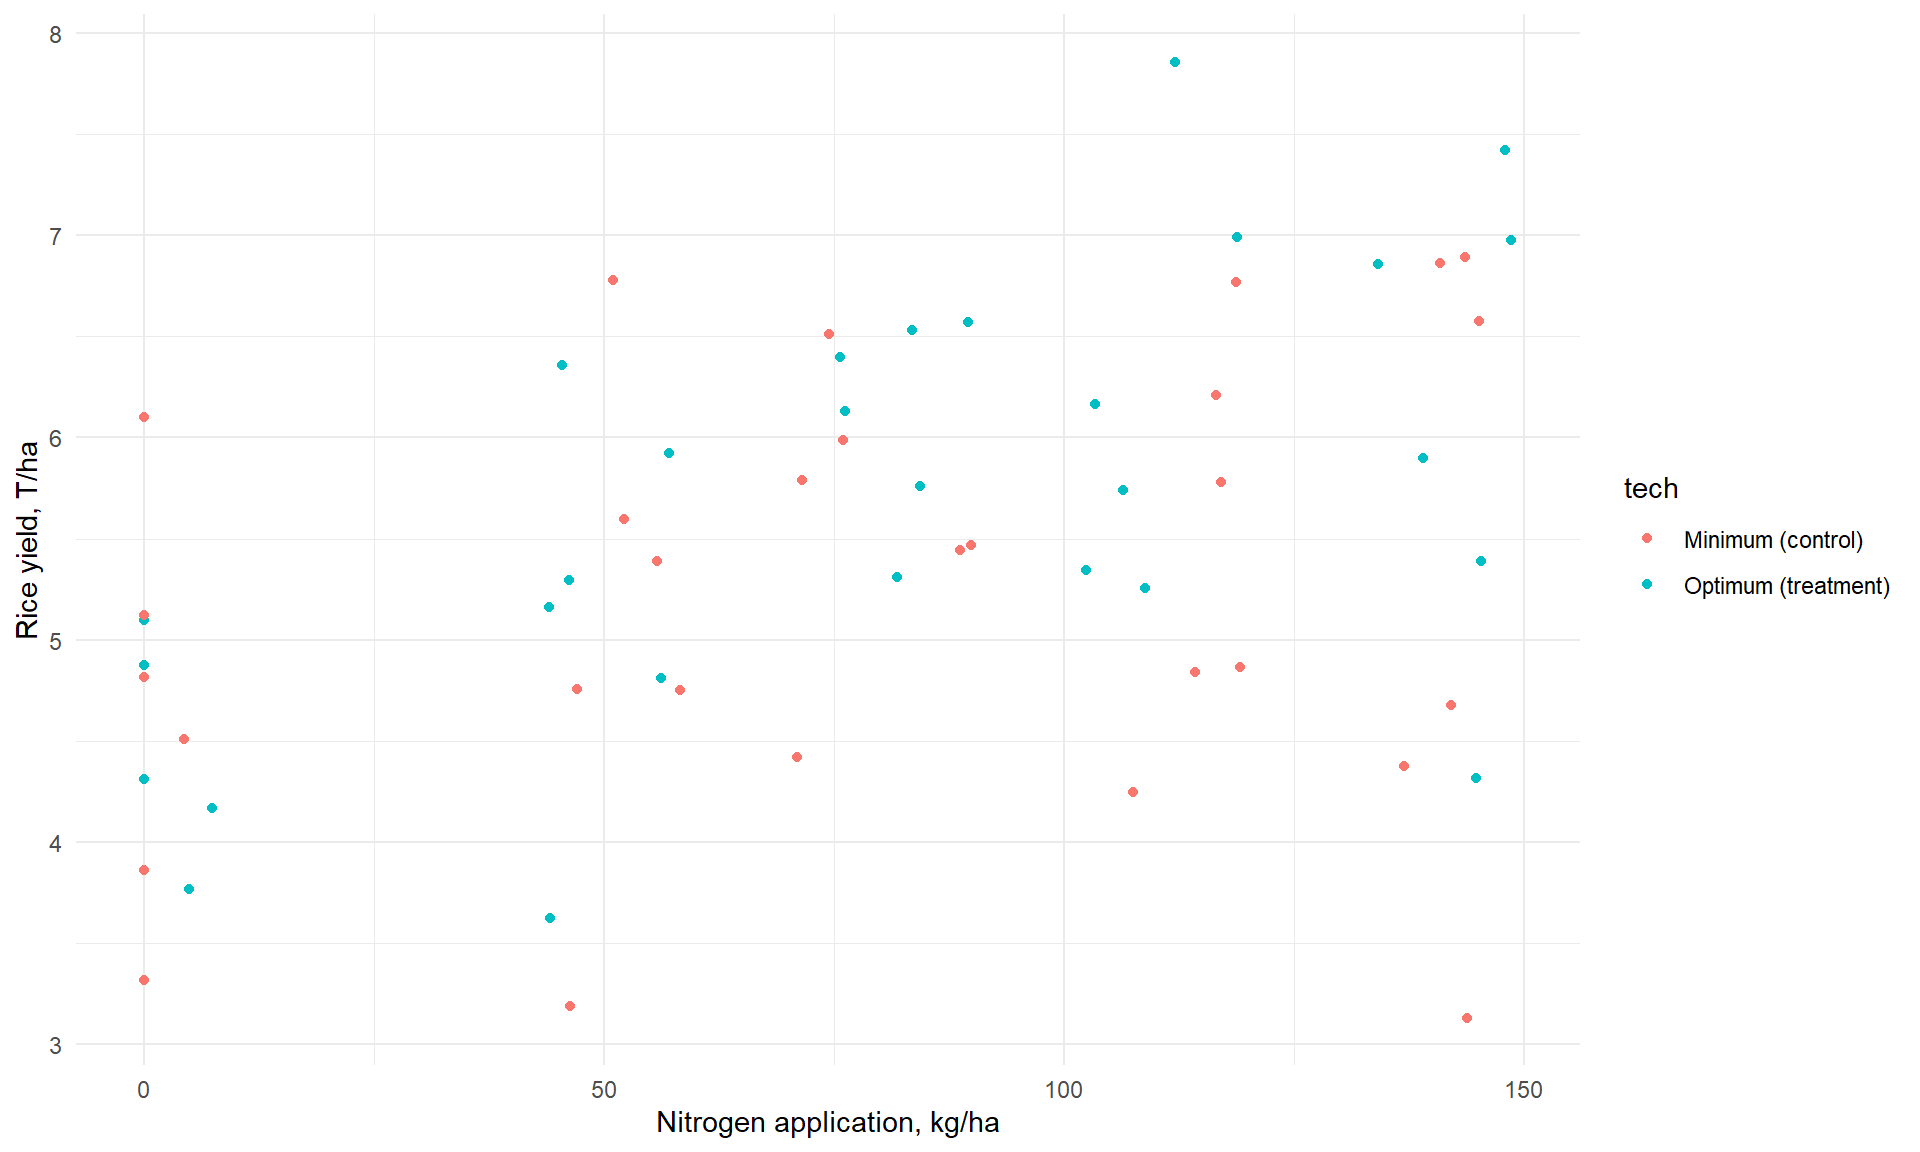
How (can we at all) measure the effects of other factors such as fertilizer application on the yields?
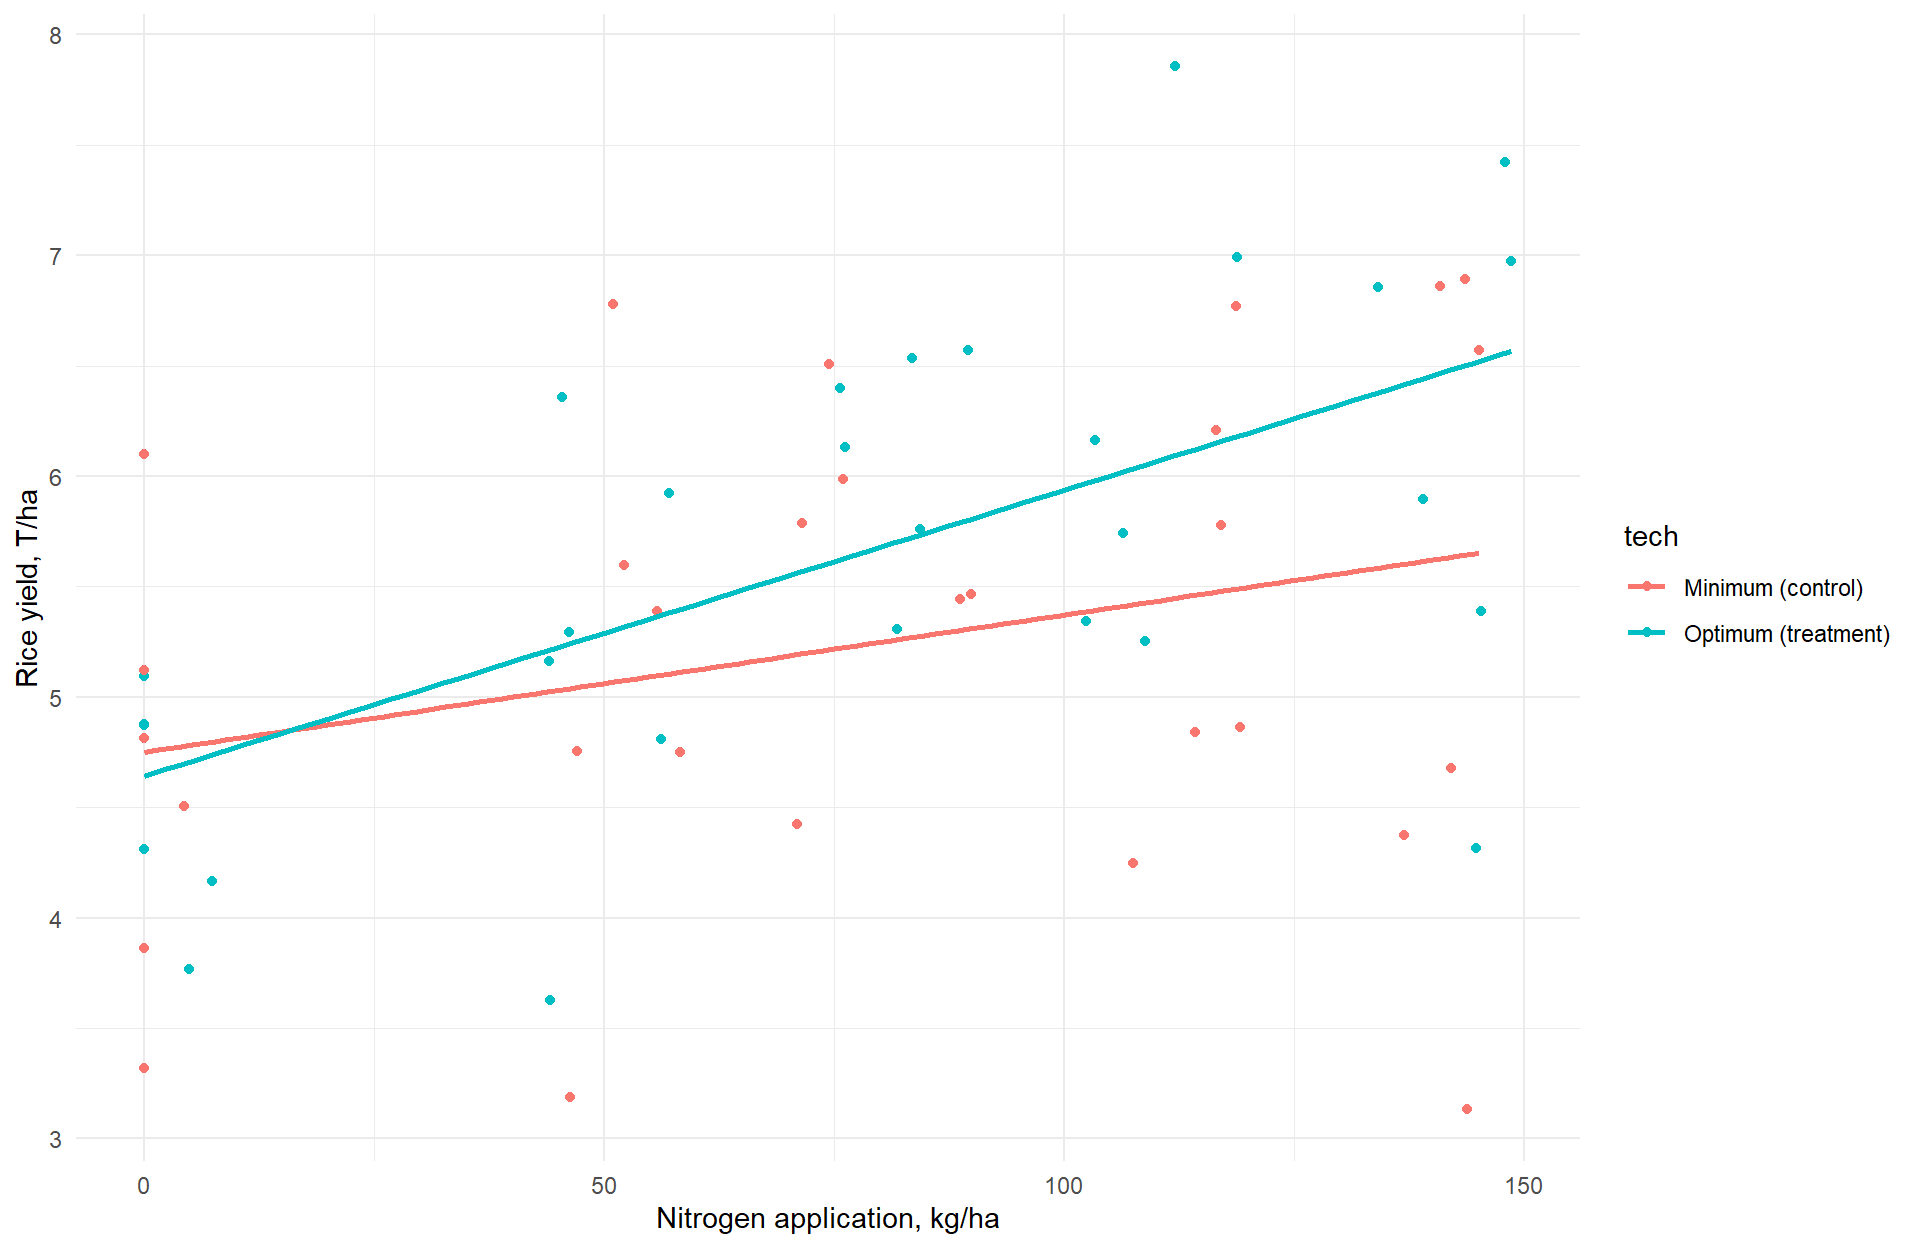
How to measure the effect of nitrogen fertilizer on yield?