Part 1: Statistics and Econometrics. MK68-2024/25
Justus Liebig University Giessen
Institute of Agricultural Policy and Market Research
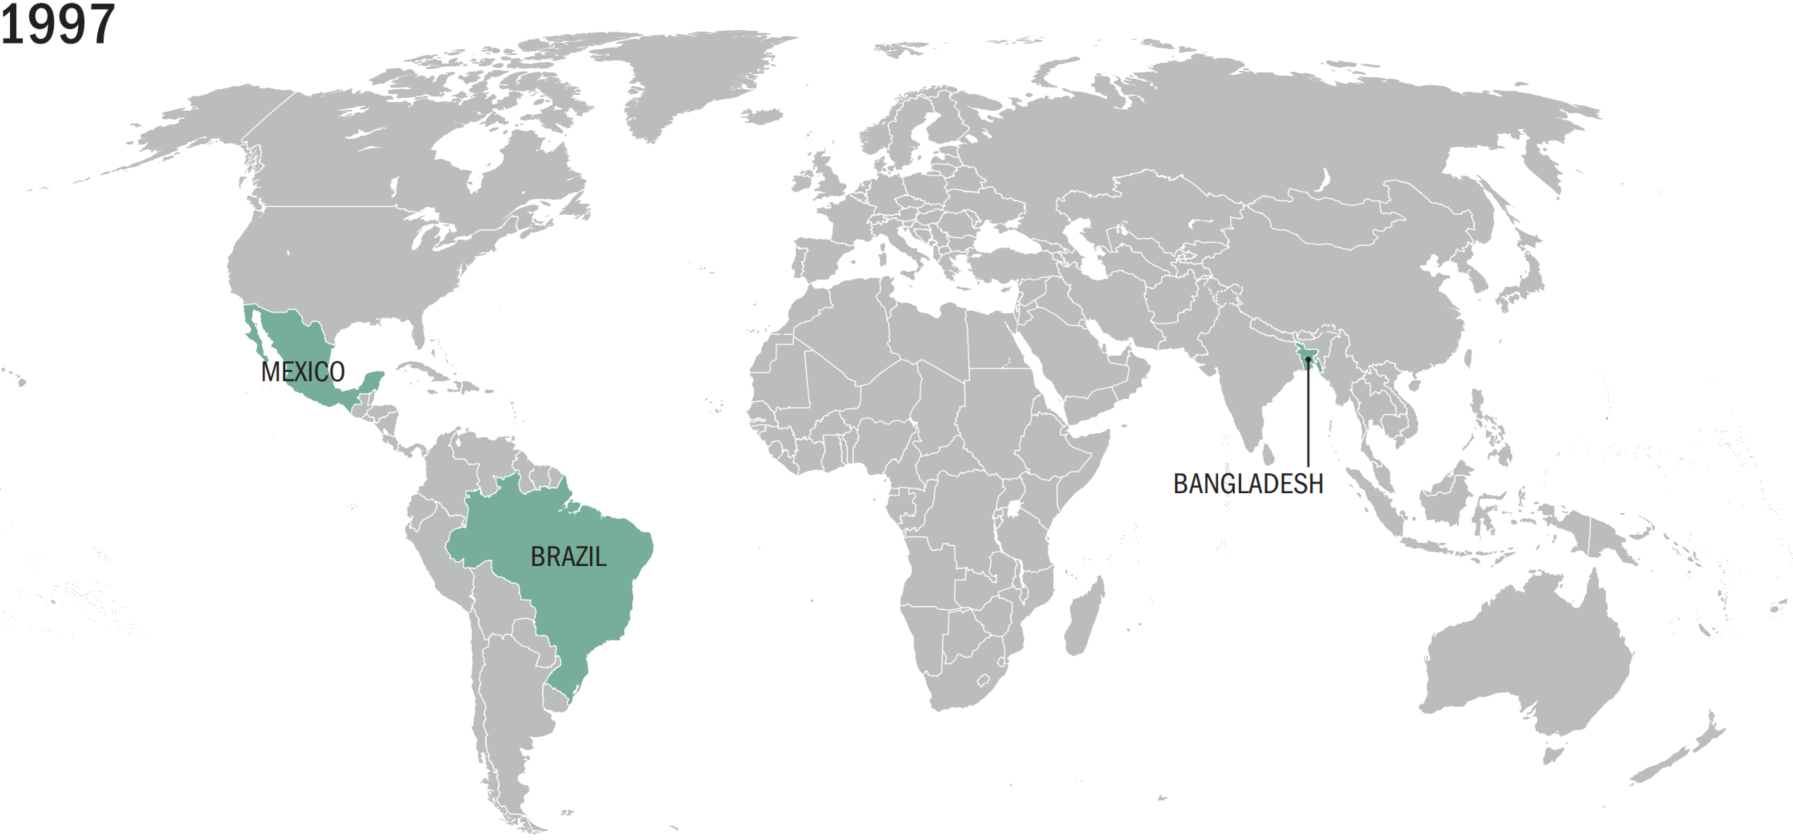
Let us consider an example of CONDITIONAL CASH TRANSFERS’ causal effect on children school enrollment.
See: CH 5. The Impact of CCT Programs on the Accumulation of Human Capital from (Fiszbein et al. 2009).
CCTs are programs that transfer cash on the condition of making pre-specified investments in human capital and children. (Fiszbein et al. 2009, fig. 1)
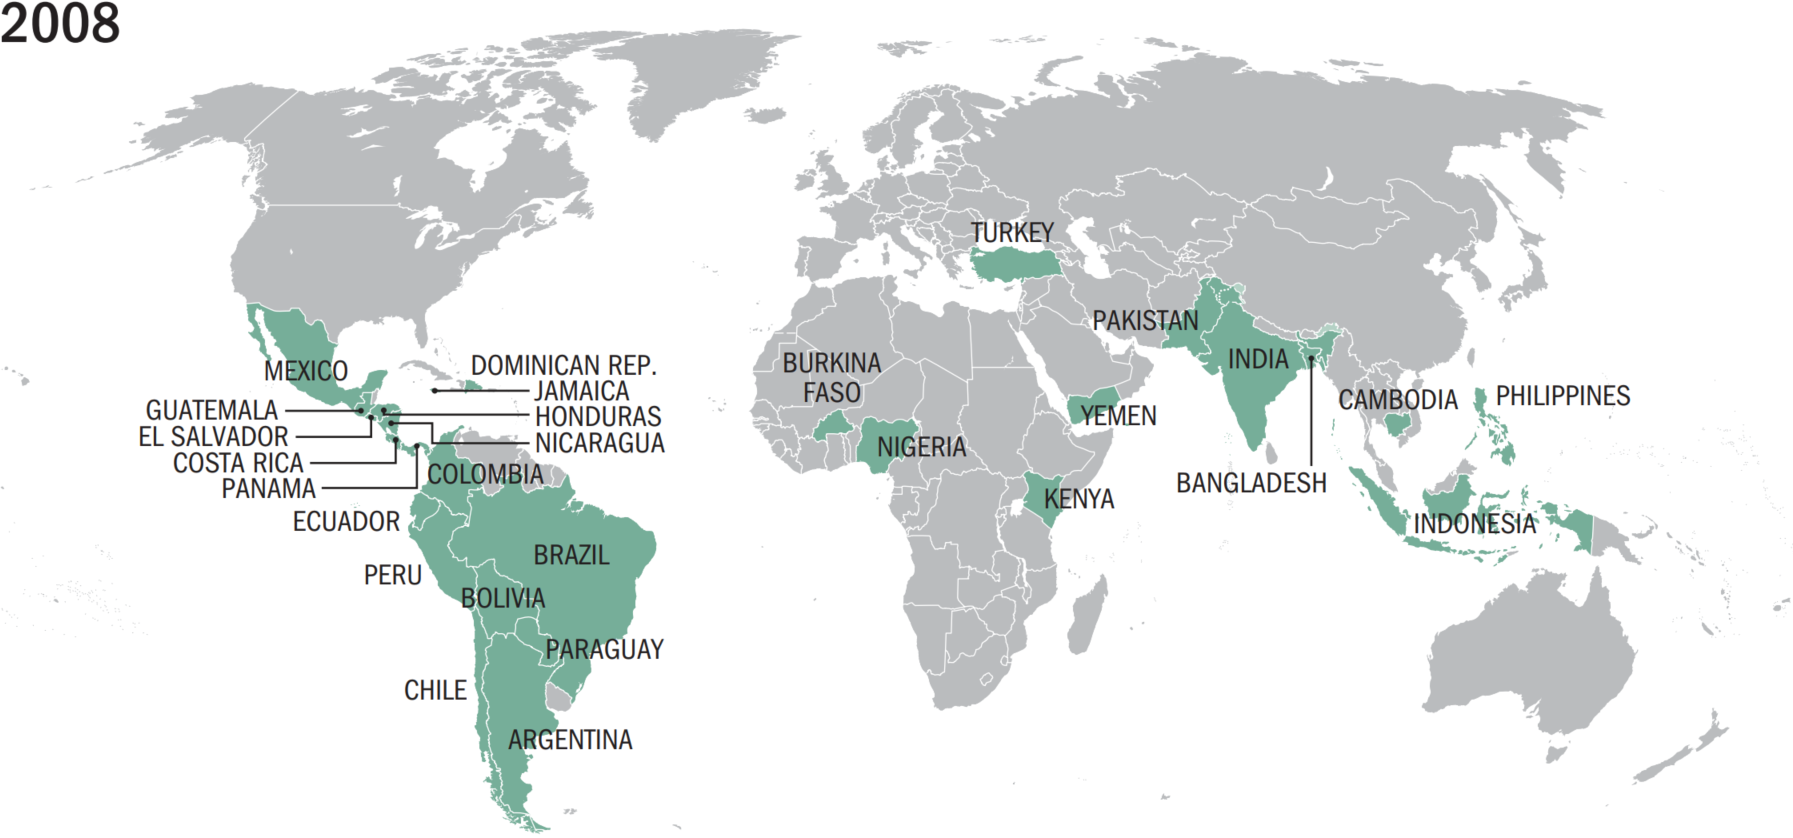
What statistical concepts ensure that the difference in school enrollment between the treatment and control is caused by the treatment?
Research Designed with the RCT:
the Law of Large Numbers (LLN):
The RCT + LLN = Ceteris Paribus;
The control group is a perfect counterfactual when three conditions are met:
has the same characteristics, on average, as the treatment group;
remains unaffected by the treatment; and
reacts to the treatment in the same way as the treatment group;
When these three conditions are met, the treatment causes the effect ceteris paribus (Gertler et al. 2016).
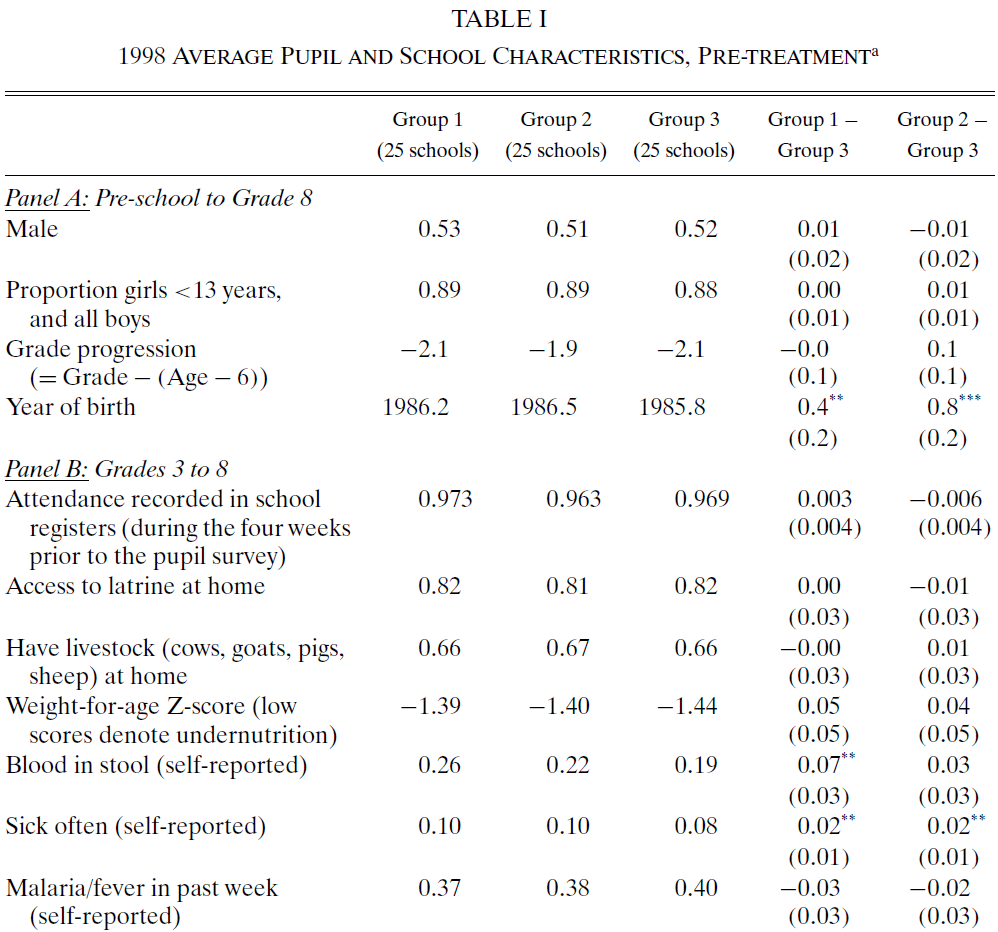
What statistical tools are used to check that control and treatment groups are the same on average?
Checks and balance tables
performs a mean-difference test between treatment and control for
variables that are (should be) independent of treatment
No significant differences (failing to reject \(H_0\)) suggest that the two groups are the same on average
Any significant differences (rejecting \(H_0\) at the \(\alpha\) level of significance) imply that the two groups are not random.
Other things are equal! The “other things” are:
measurable features (age, height, costs, …);
measurable but absent from our data;
nonmeasurable factors (ability, effort, connections, …)
Source: (Miguel and Kremer 2004) table 1.
Variable-specific means are not the same across groups.
Note: *** indicates p-value < 0.01, ** p-value < 0.05, and * p-value < 0.1.
Formulate \(H_0\) and \(H_1\).
\(H_0: \text{diff} = 0\)
\(H_1: \text{diff} \ne 0\)
Use a statistical test, called t-test
Is a statistical test use to conclude about the population based on a sample.
One sample t-test: Compares a population parameter \(\mu\) to an arbitrary number?
Two sample t-test: Compares difference between two parameters \(\mu_1\) and \(\mu_2\) in the population?
Its purpose is to infer:
whether or not the population parameter \(\mu\) (mean, or else)
is different from an arbitrary number (usually zero: \(\mu_{0} = 0\))
based on our sample estimates of
Step 1: Formulate our Hypotheses
\(H_0: \mu = 0\)
\(H_1: \mu \ne 0\)
Step 2: Compute out Statistics based on the sample
Estimated parameter: \(\widehat{\mu}\)
Standard Deviation: \(s\)
Zero hypothesis value: \(\mu_0 = 0\)
Significance level: \(\alpha = 0.05\)
Number of observations: \(n\)
Step 3: Compute t-statistics (and a p-value using the PC)
\[ t = \frac{\hat\mu - \mu_0}{\text{se}} = \frac{\sqrt{n} ( \hat\mu - \mu_0)}{s}\,, \]
where \(se = s / \sqrt{n}\) is the standard error of the estimate;
Step 4: Conclude
Reject \(H_0\) if:
\(|t| > 2\) the “rule of thumb”
\(\text{p-value} < \alpha\) (probability of type I error < level of significance
Fail to reject \(H_0\)
Are the treatment and control groups on average similar?
Table source: (Miguel and Kremer 2004).
Note: *** indicates p-value < 0.01, ** p-value < 0.05, and * p-value < 0.1.
If yes: A mean comparison of the outcome variables reveals the causal effect
If no: We need to use other methods to measure the effect, such as regression.
Do the CCTs improve children school enrollment? (Fiszbein et al. 2009)
The effect: \(\widehat{\text{Enrollment change}} = \widehat{\text{After the CCT}} - \widehat{\text{Before the CCT}}\)
Hypothesis:
\(H_0:\) \(\text{Enrollment change} = 0\)
\(H_1:\) \(\text{Enrollment change} > 0\)
Statistical test:
One-sided t-test
at the 5% level of significance \(\alpha = 0.05\)
Desired t-test result:
Which t-test result indicates that CCT has a positive effect on school enrollment?
\(\text{p-value}\) \(< \alpha\) or \(\text{p-value} < 0.05\)
\(|\text{t-statistics}|\) \(> c_{df, \, 0.95}\)
We need to be able to reject \(H_0\)
Source: (Fiszbein et al. 2009)

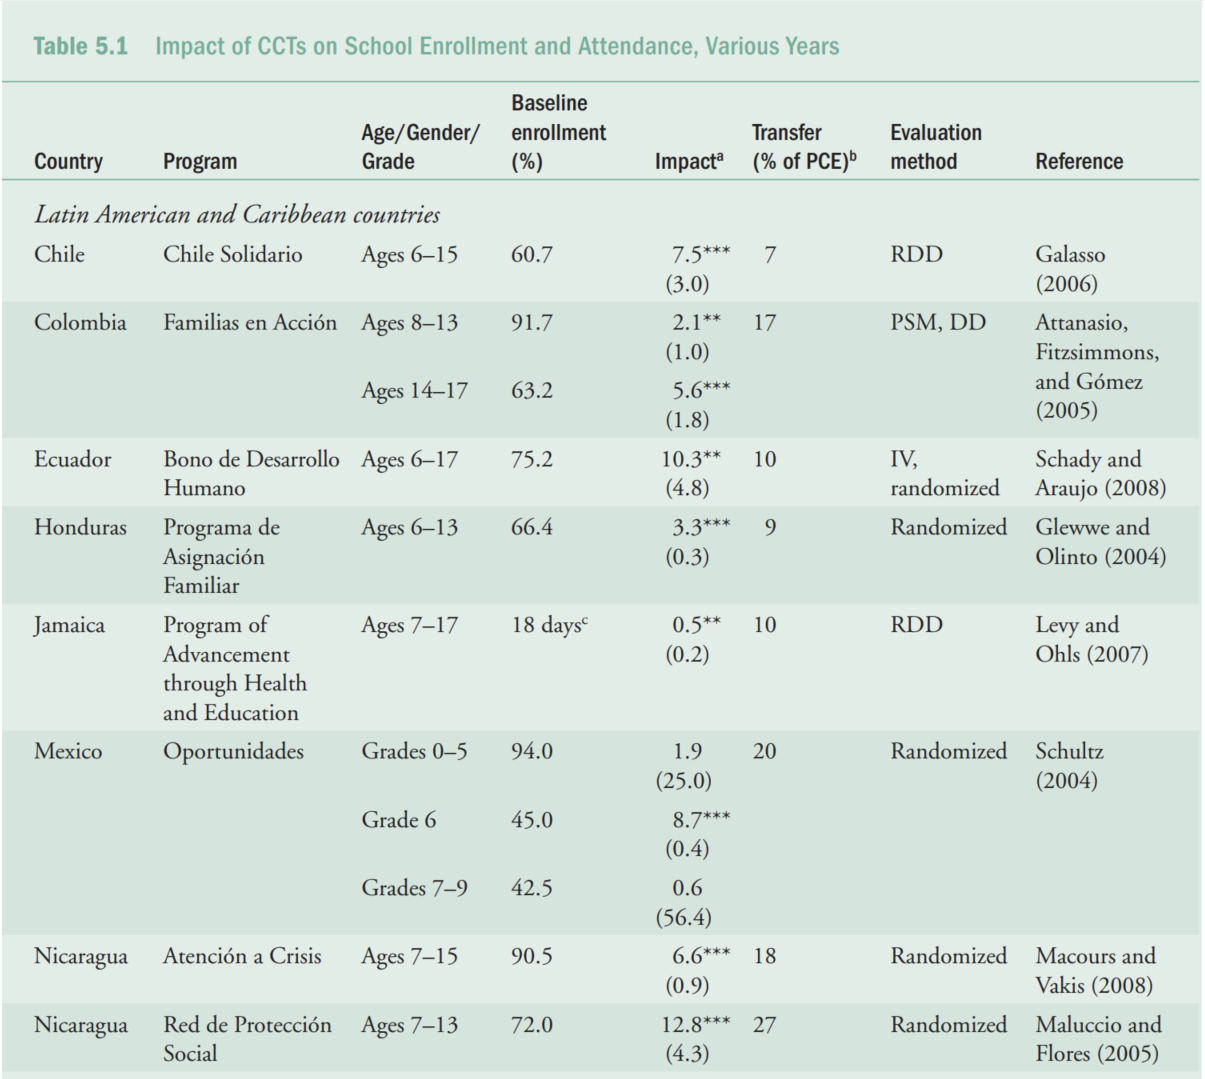
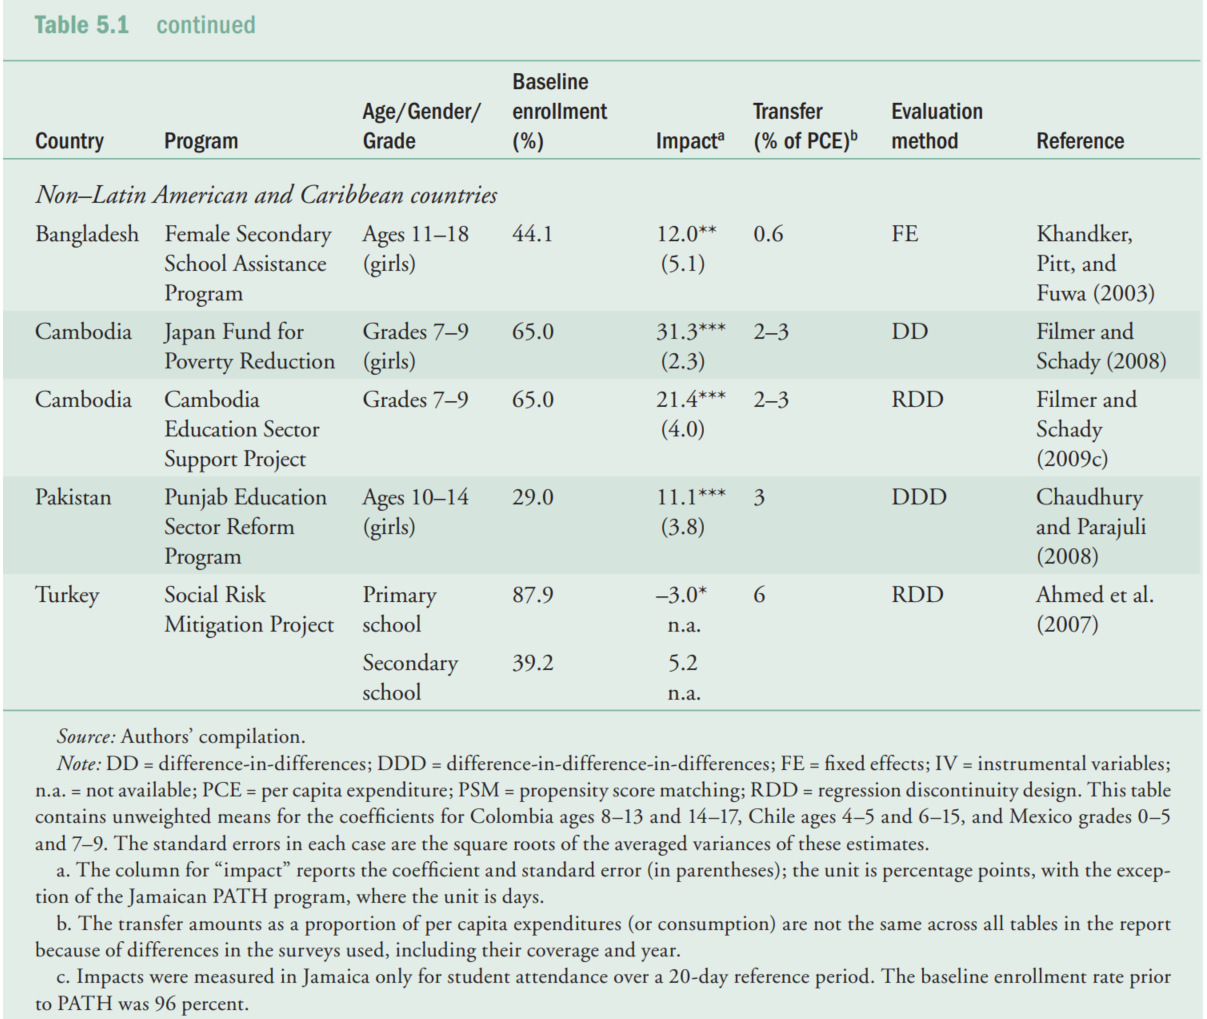
The column for “impact” reports the difference and standard error (in parentheses); the unit is percentage points, except of the Jamaican PATH program.
*, **, and *** indicates if the p-value is below a corresponding significance levels of 10, 5, and 1 percent.

Interpret results of the statistical test for country A at the X (1%, 5%) level of significance.
For example. In (Ahmed et al. 2007) authors failed to show that CCTs improve/worsen children school enrollment in Turkey. With “H0: no improvement” versus the “H1: some improvement”, the authors failed to reject the H0 at the 5% sign. level for the populations of primary and secondary school attendees …
(For example cont.) … In absolute terms, authors show a reduction in primary school enrollment by 3% and an increase in secondary school enrollment by 5.2%. However, the probability that these changes are due to sample variation (probability of type I error / p-value) is above 5% and 10% respectively. Table source: (Fiszbein et al. 2009)
OpenIntro Foundations for Inference:
Khan Academy:
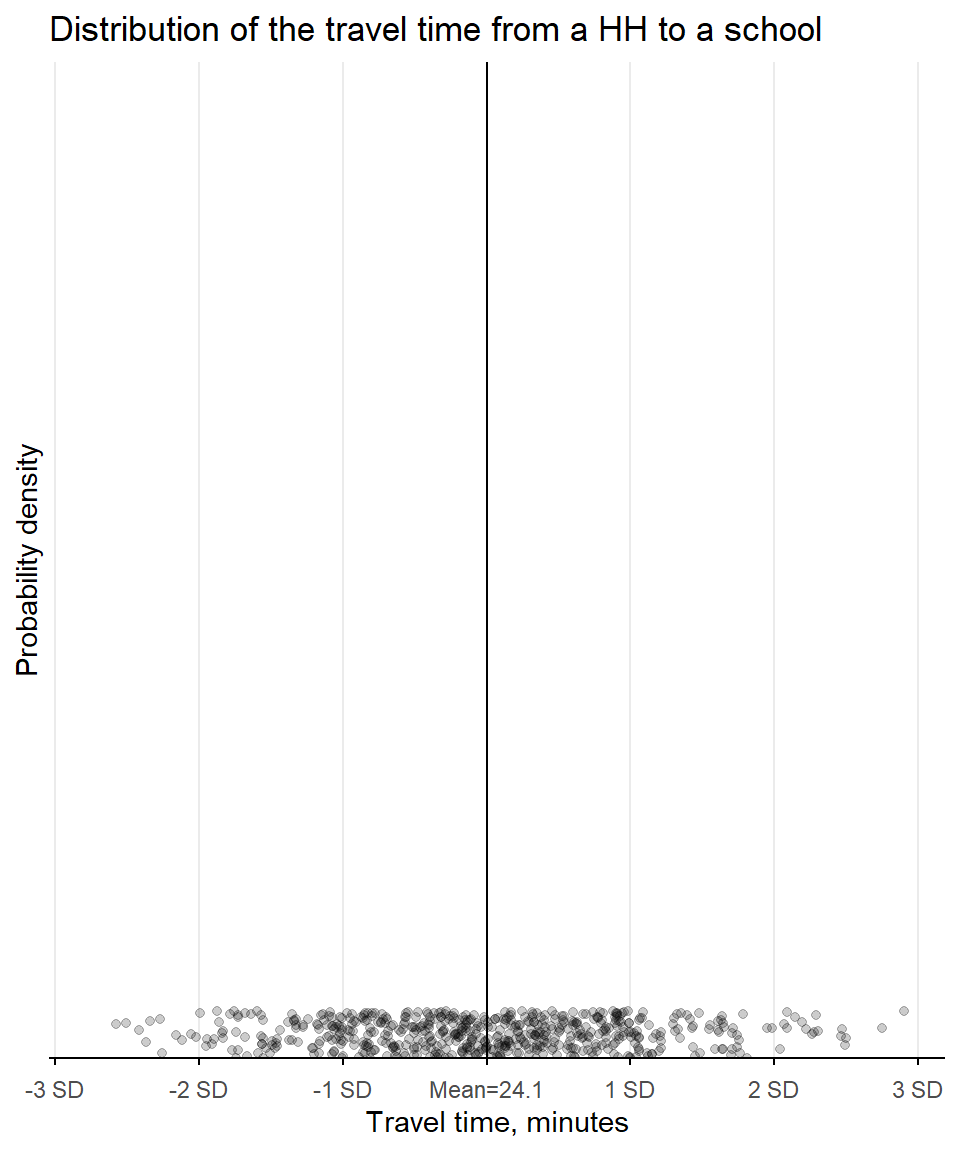
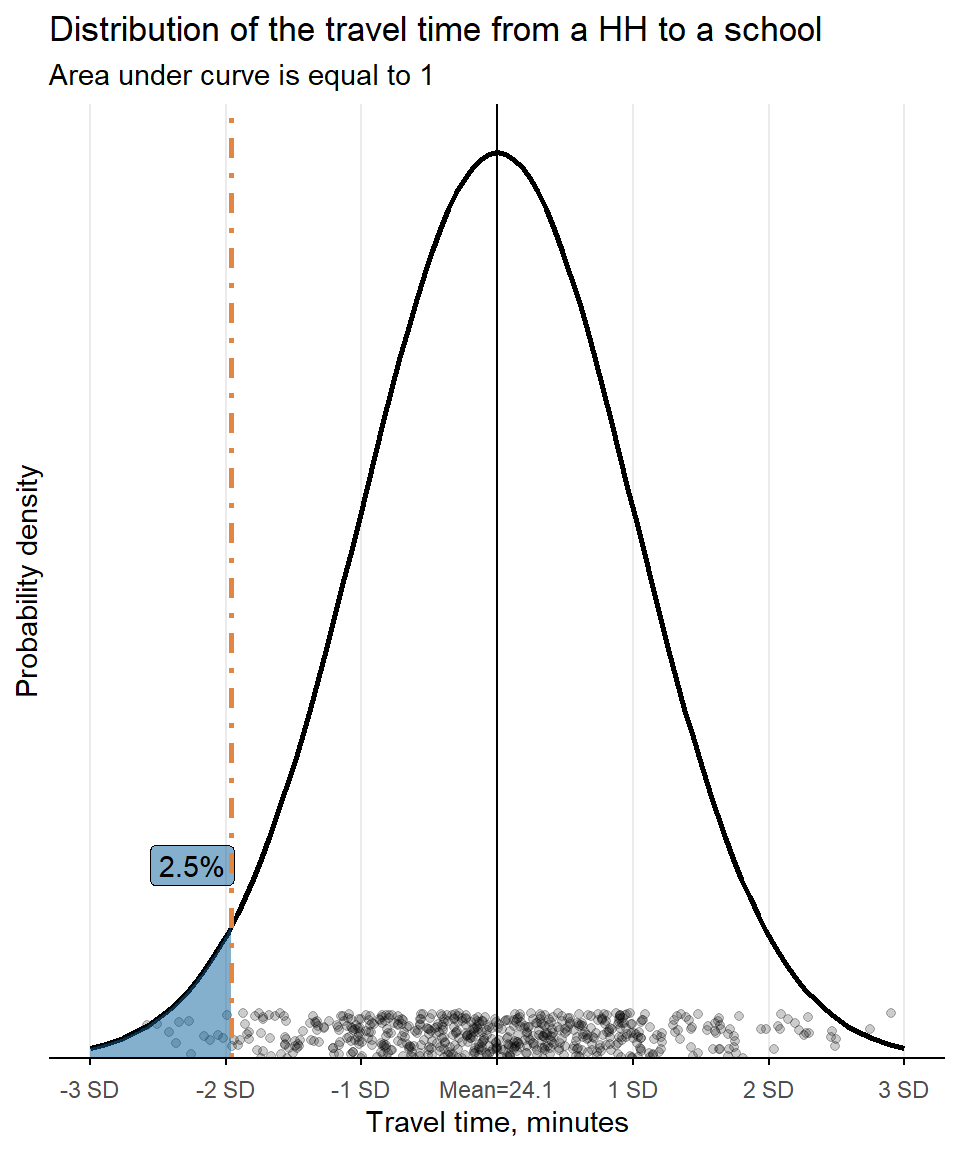
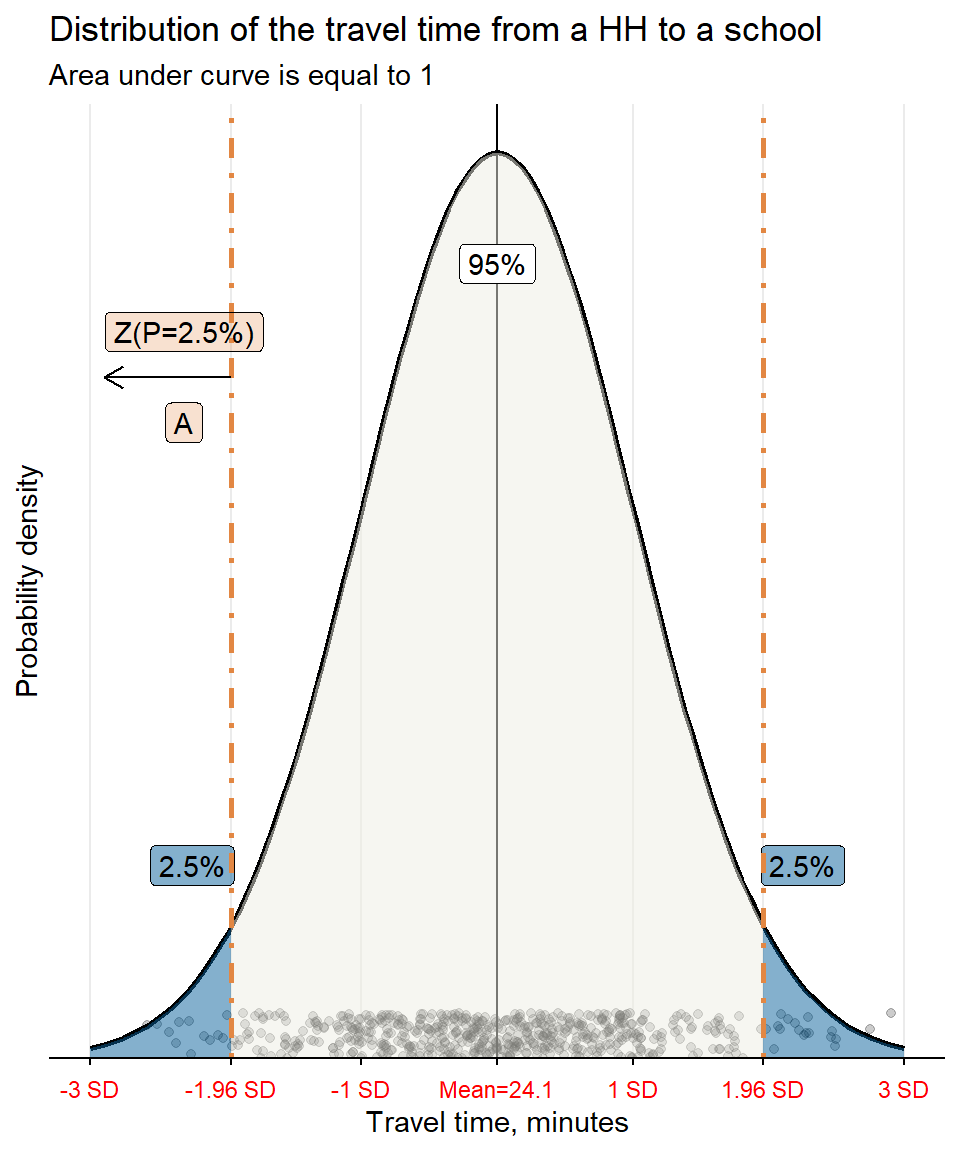
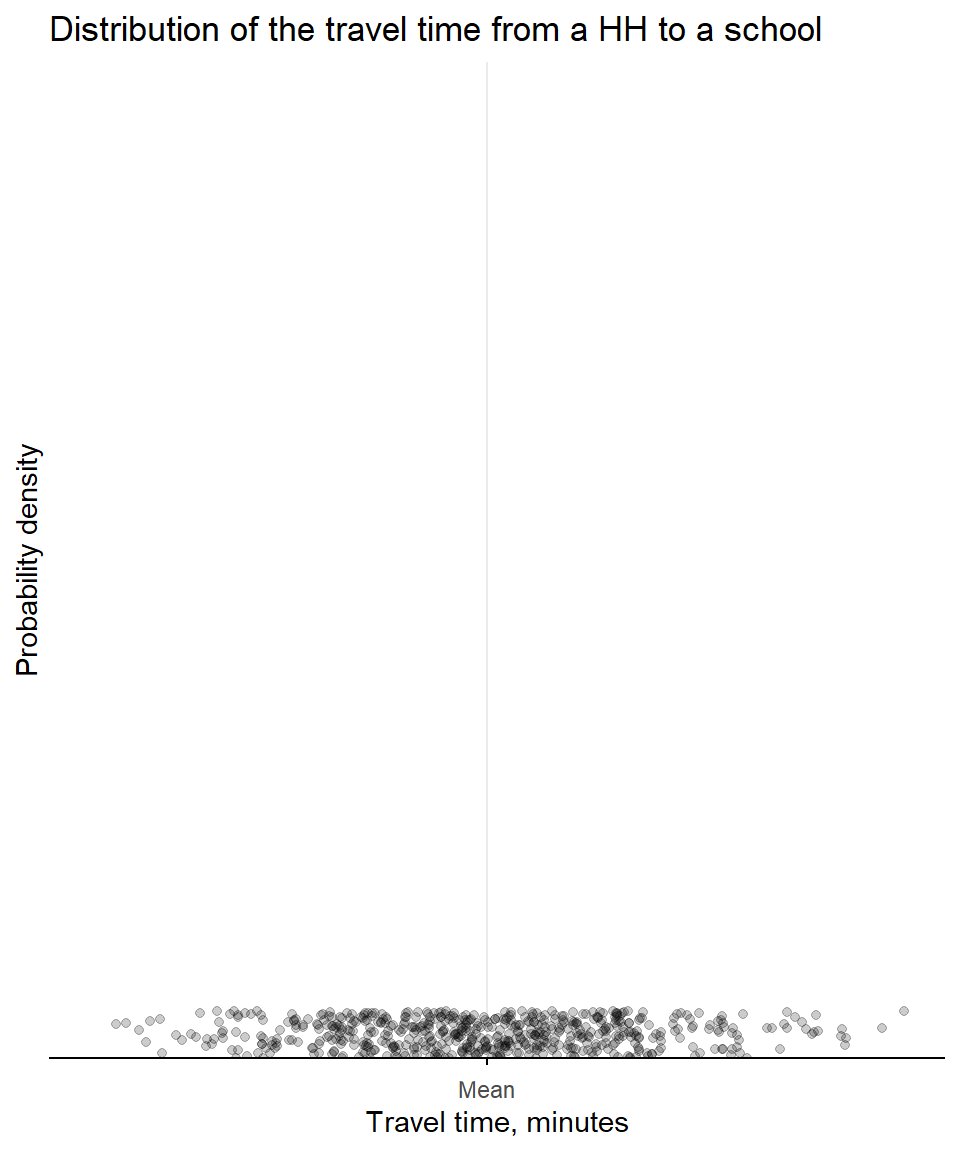
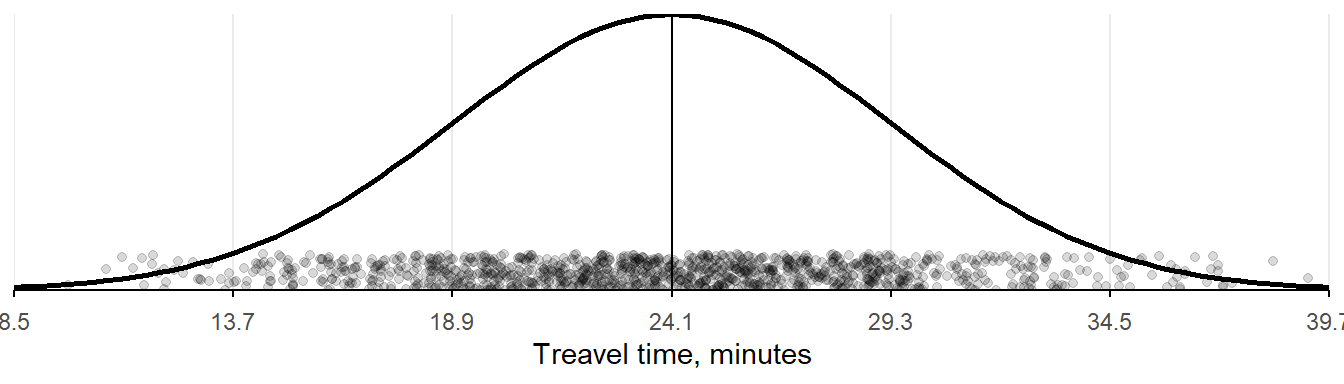
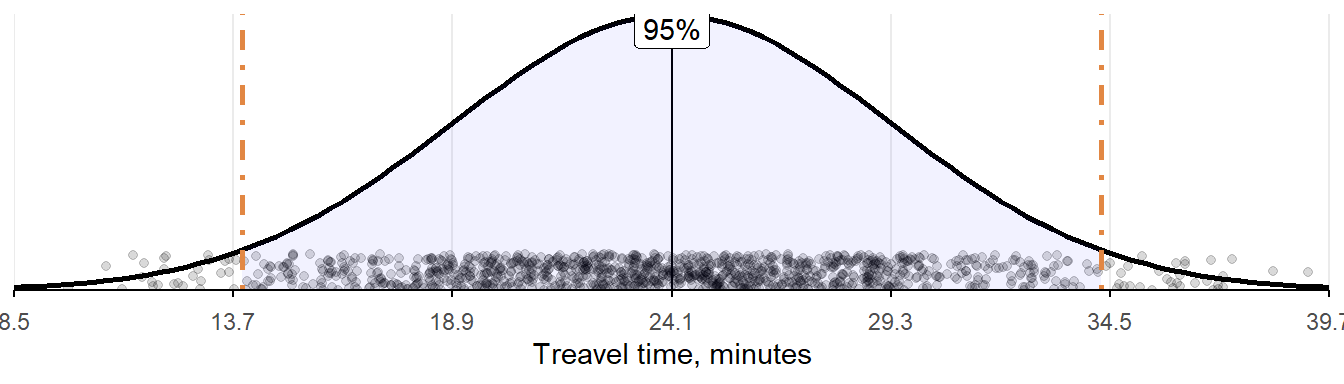
Suppose that we have measured travel time to school for the entire population of the HHs.
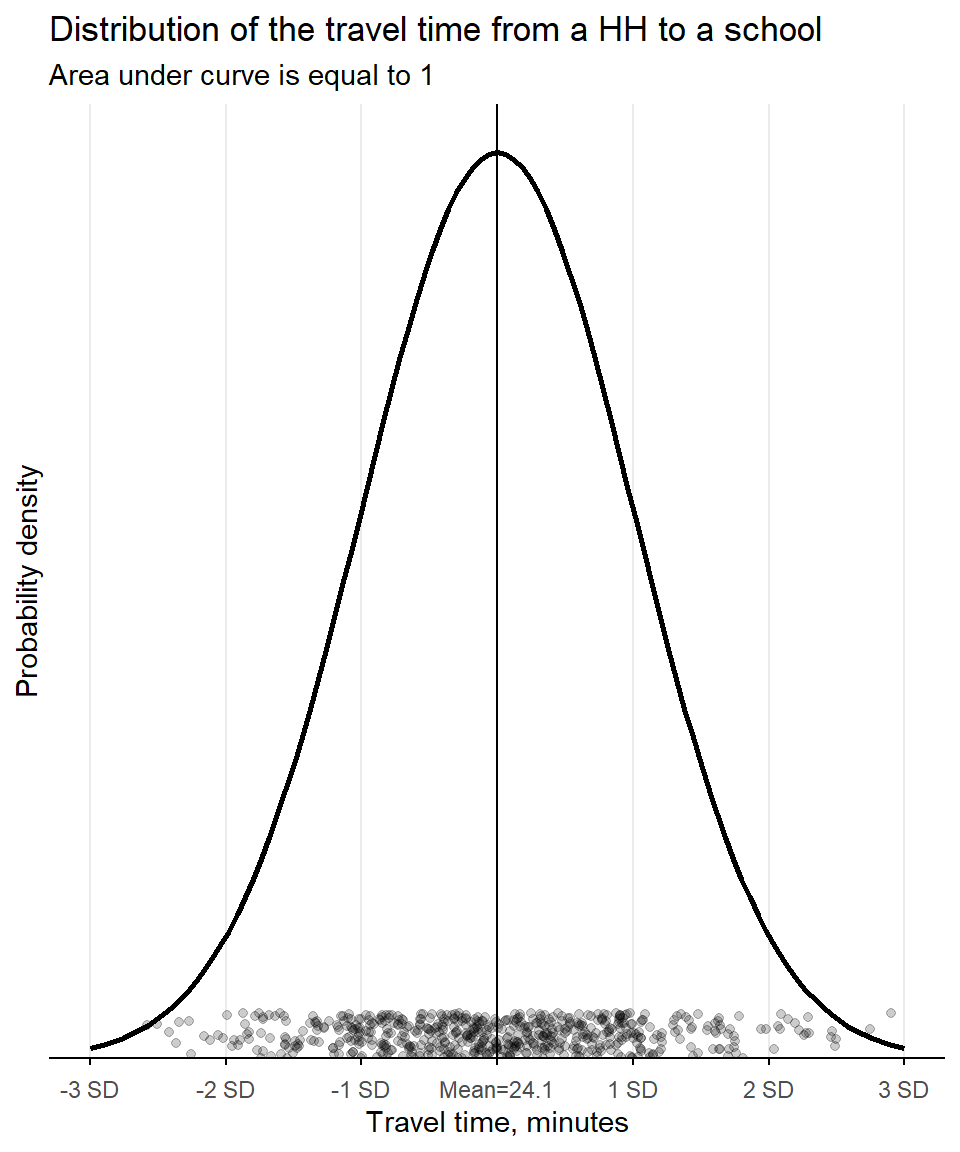
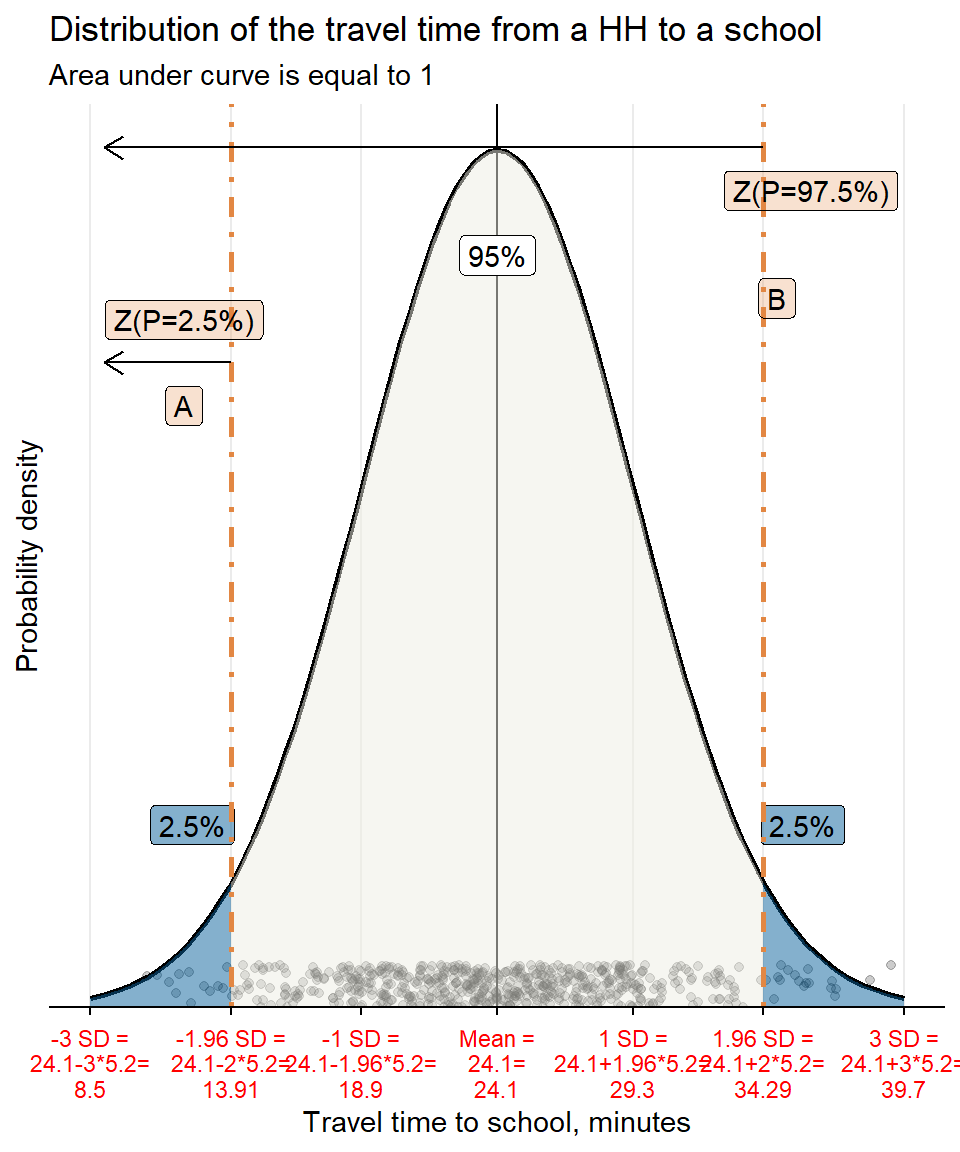
Travel time is distributed normally with:


Travel time distribution is normal with mean \(\mu\) and SD \(\sigma\):
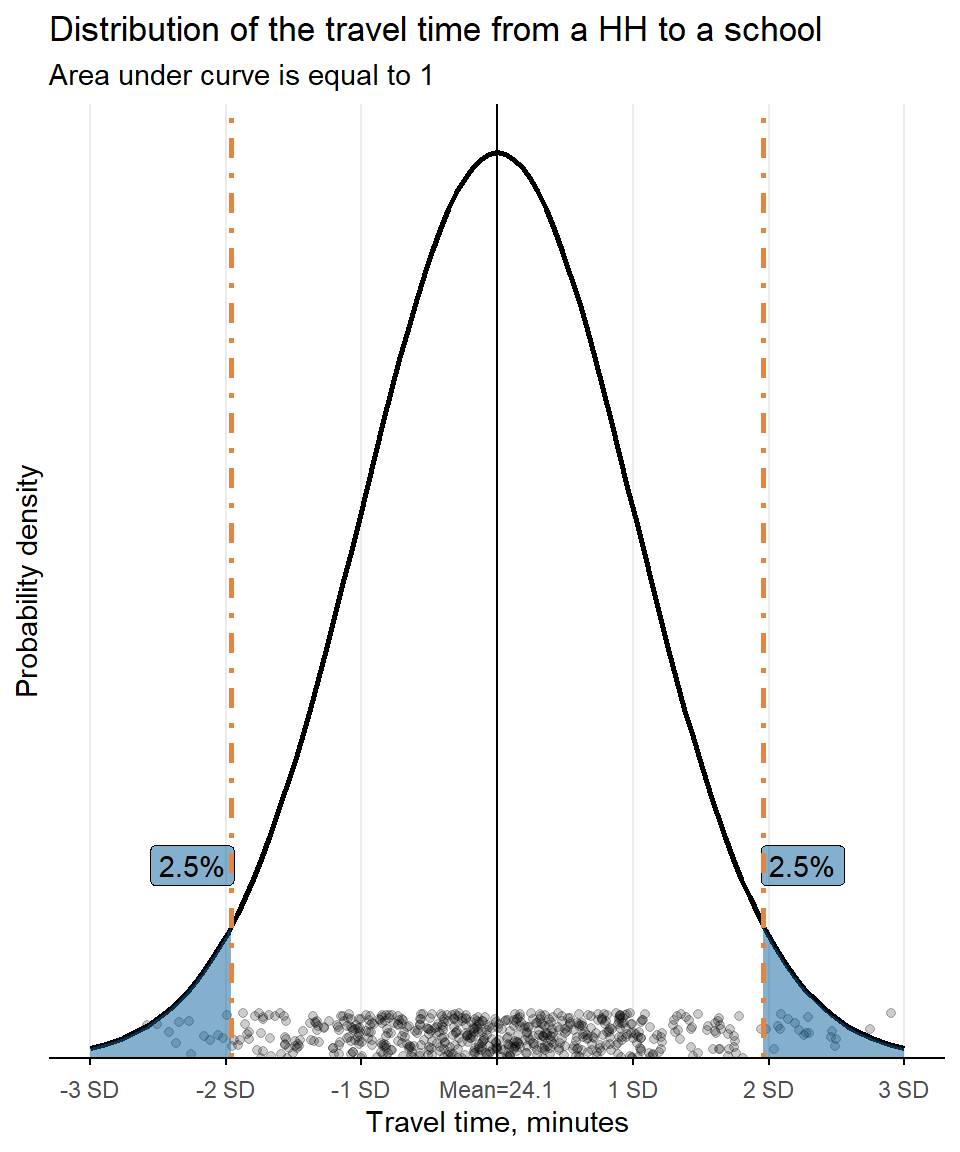
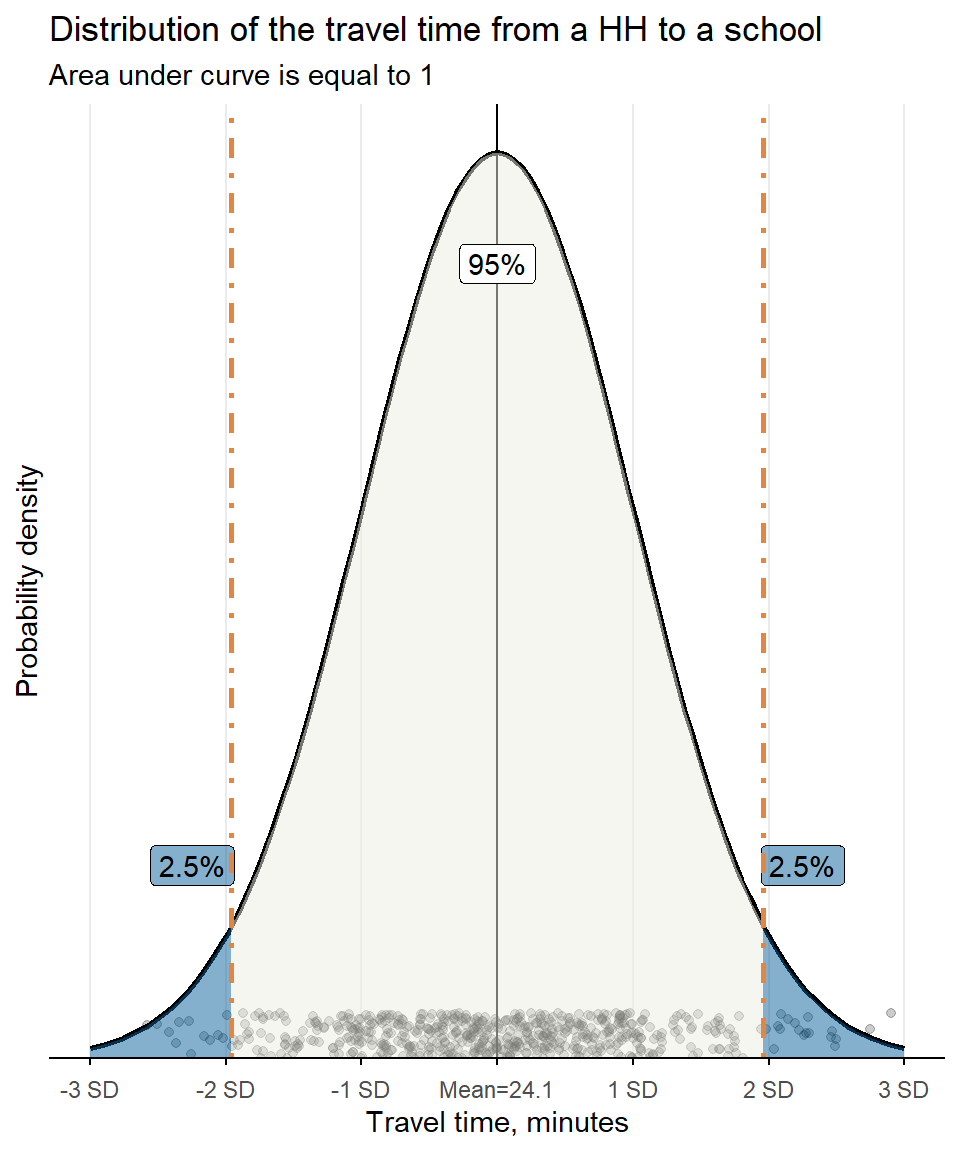
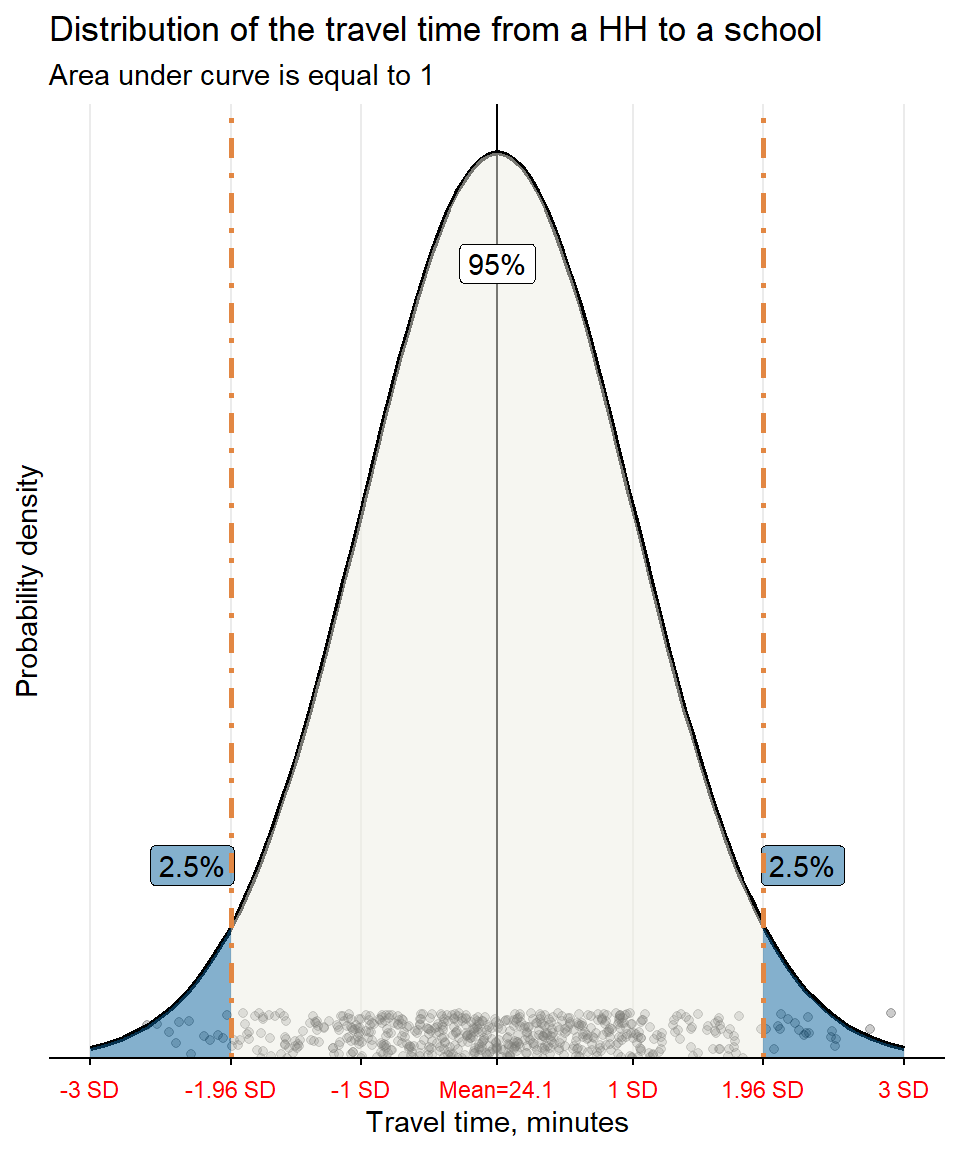
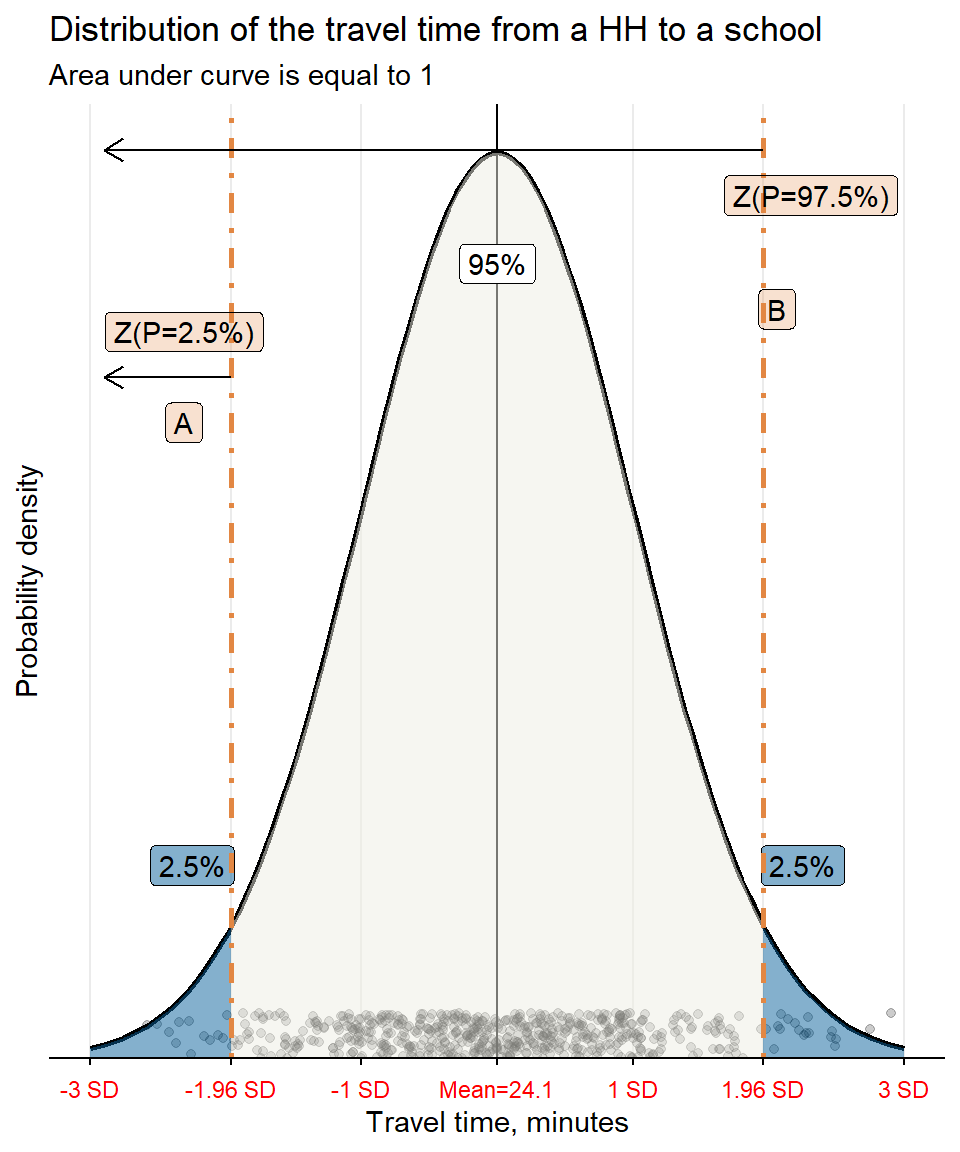
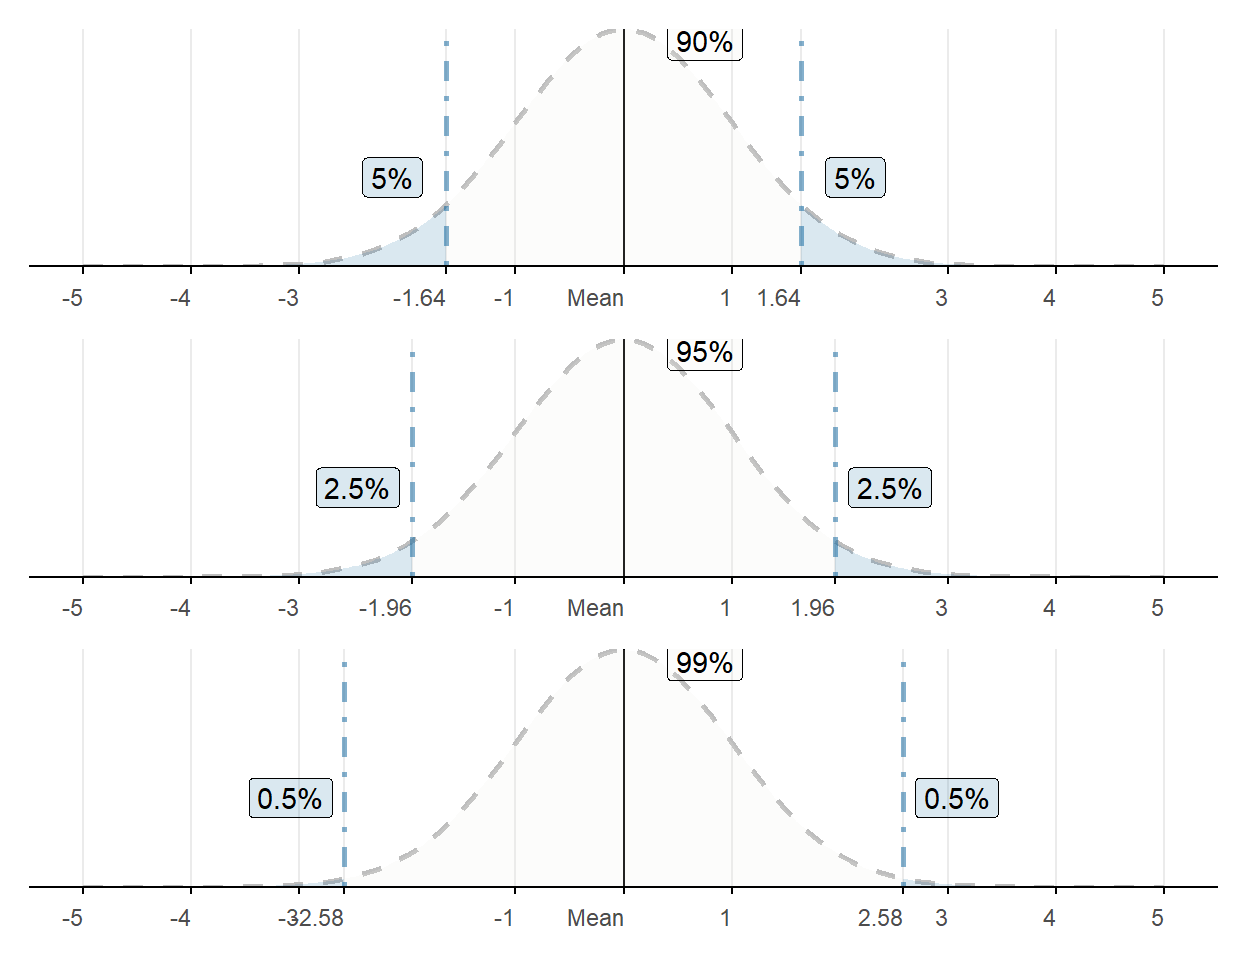
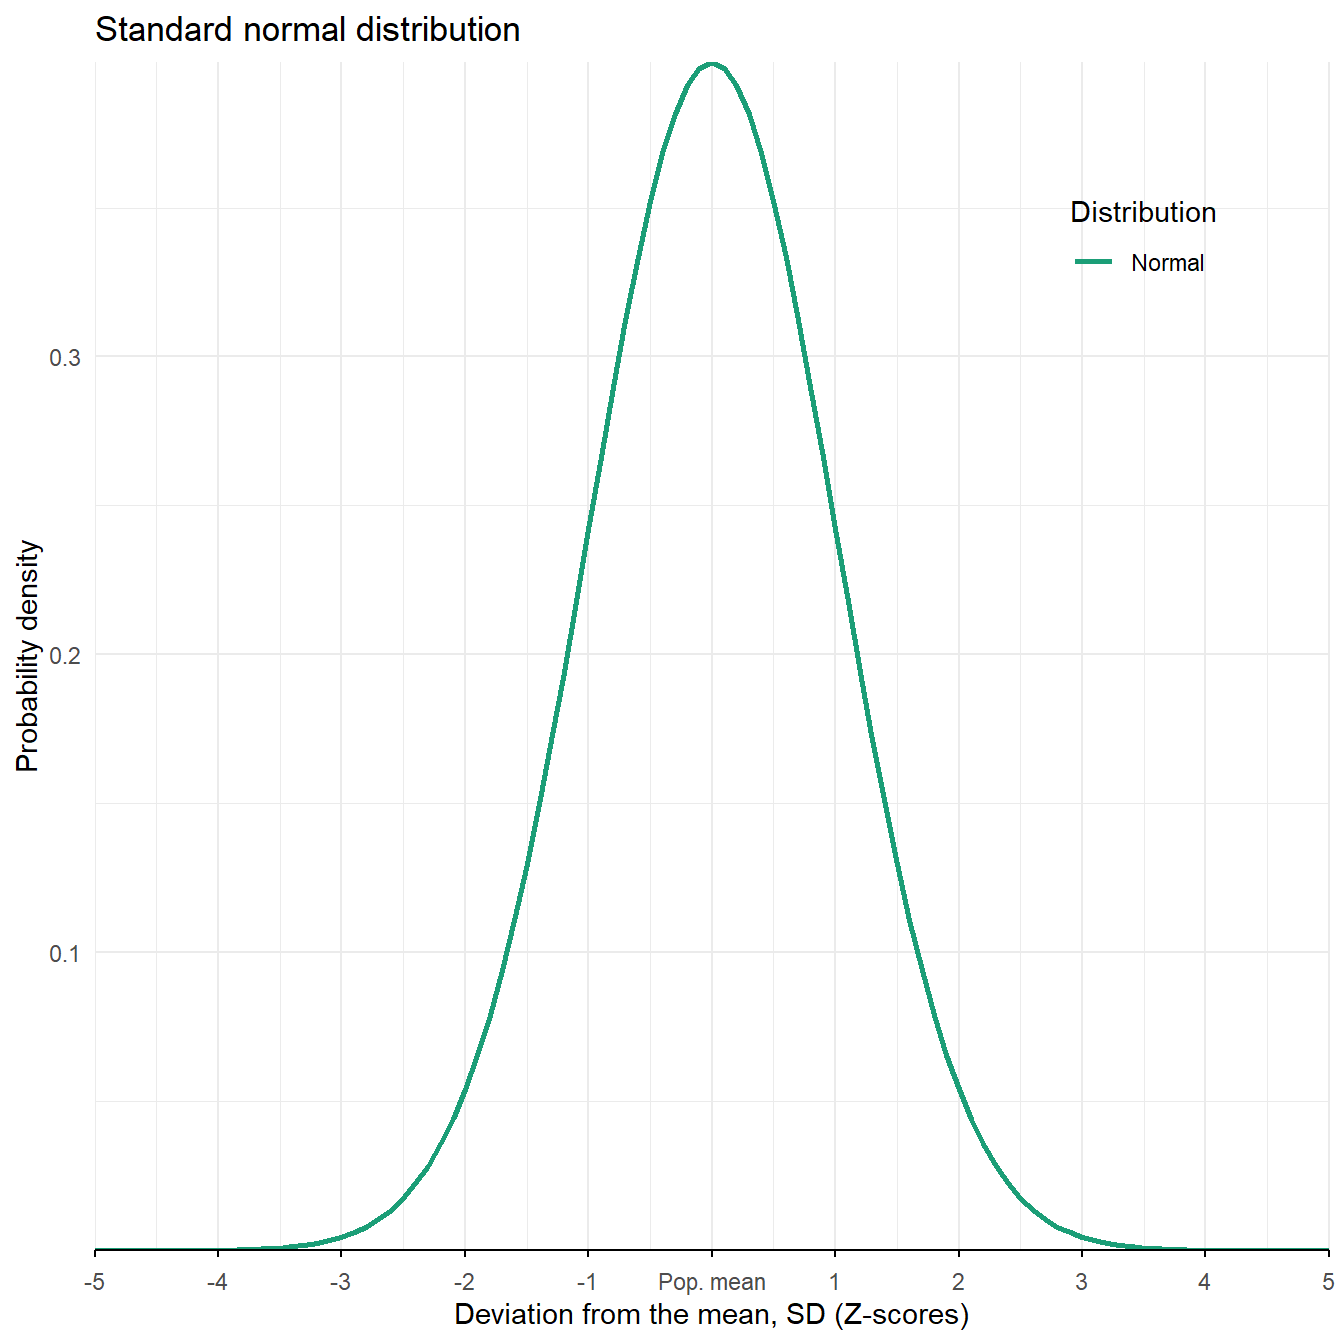
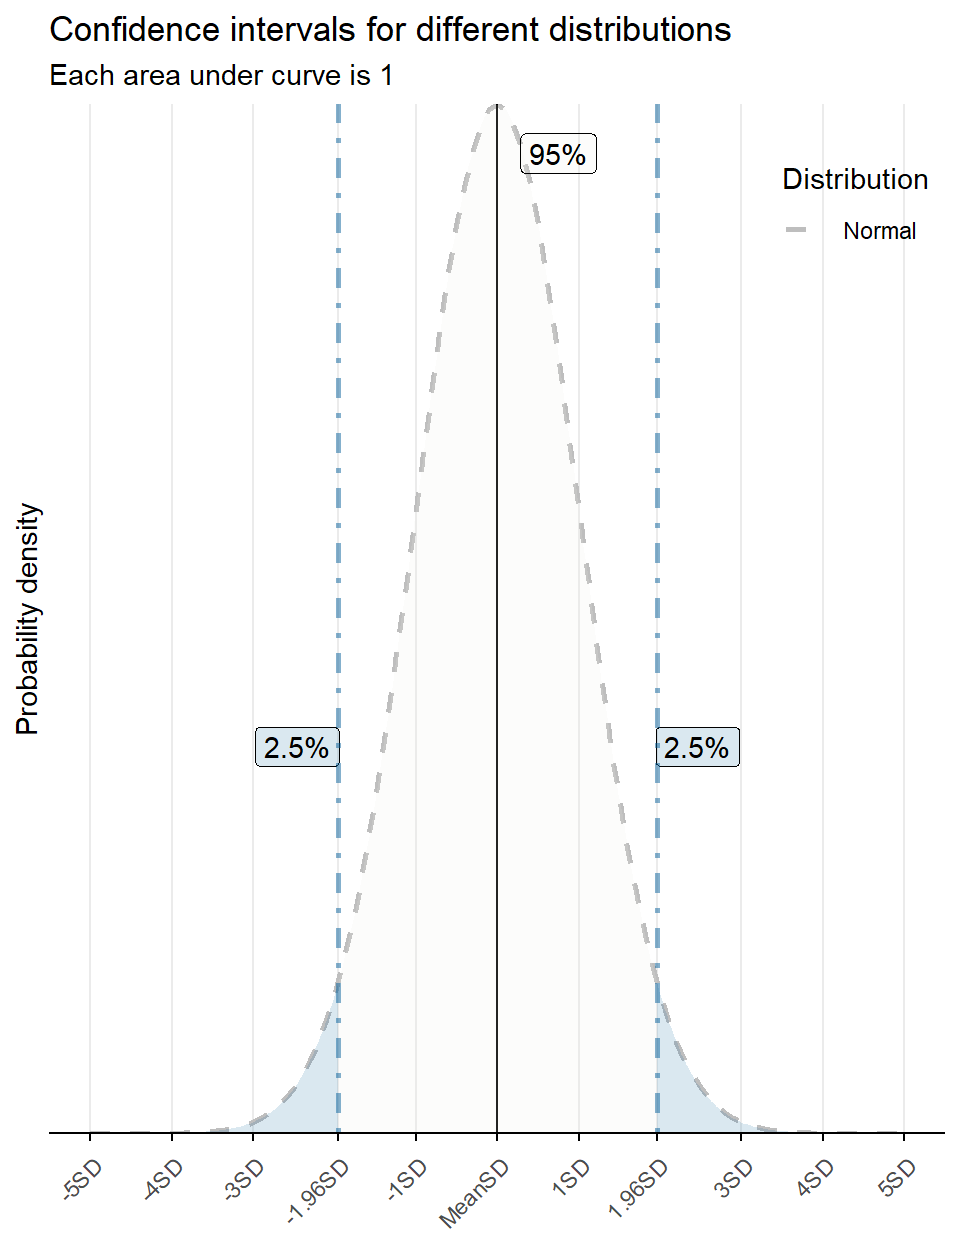
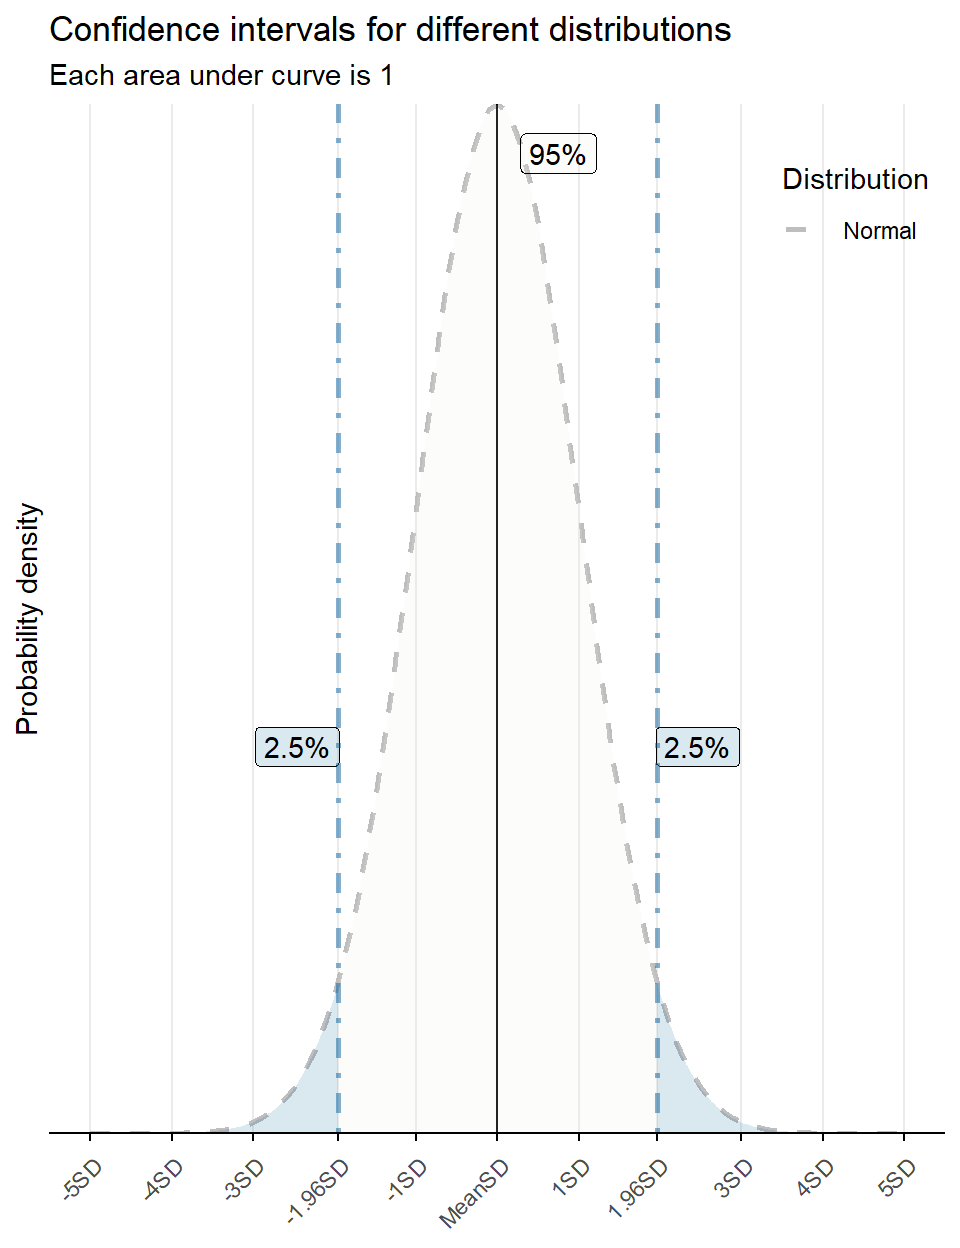
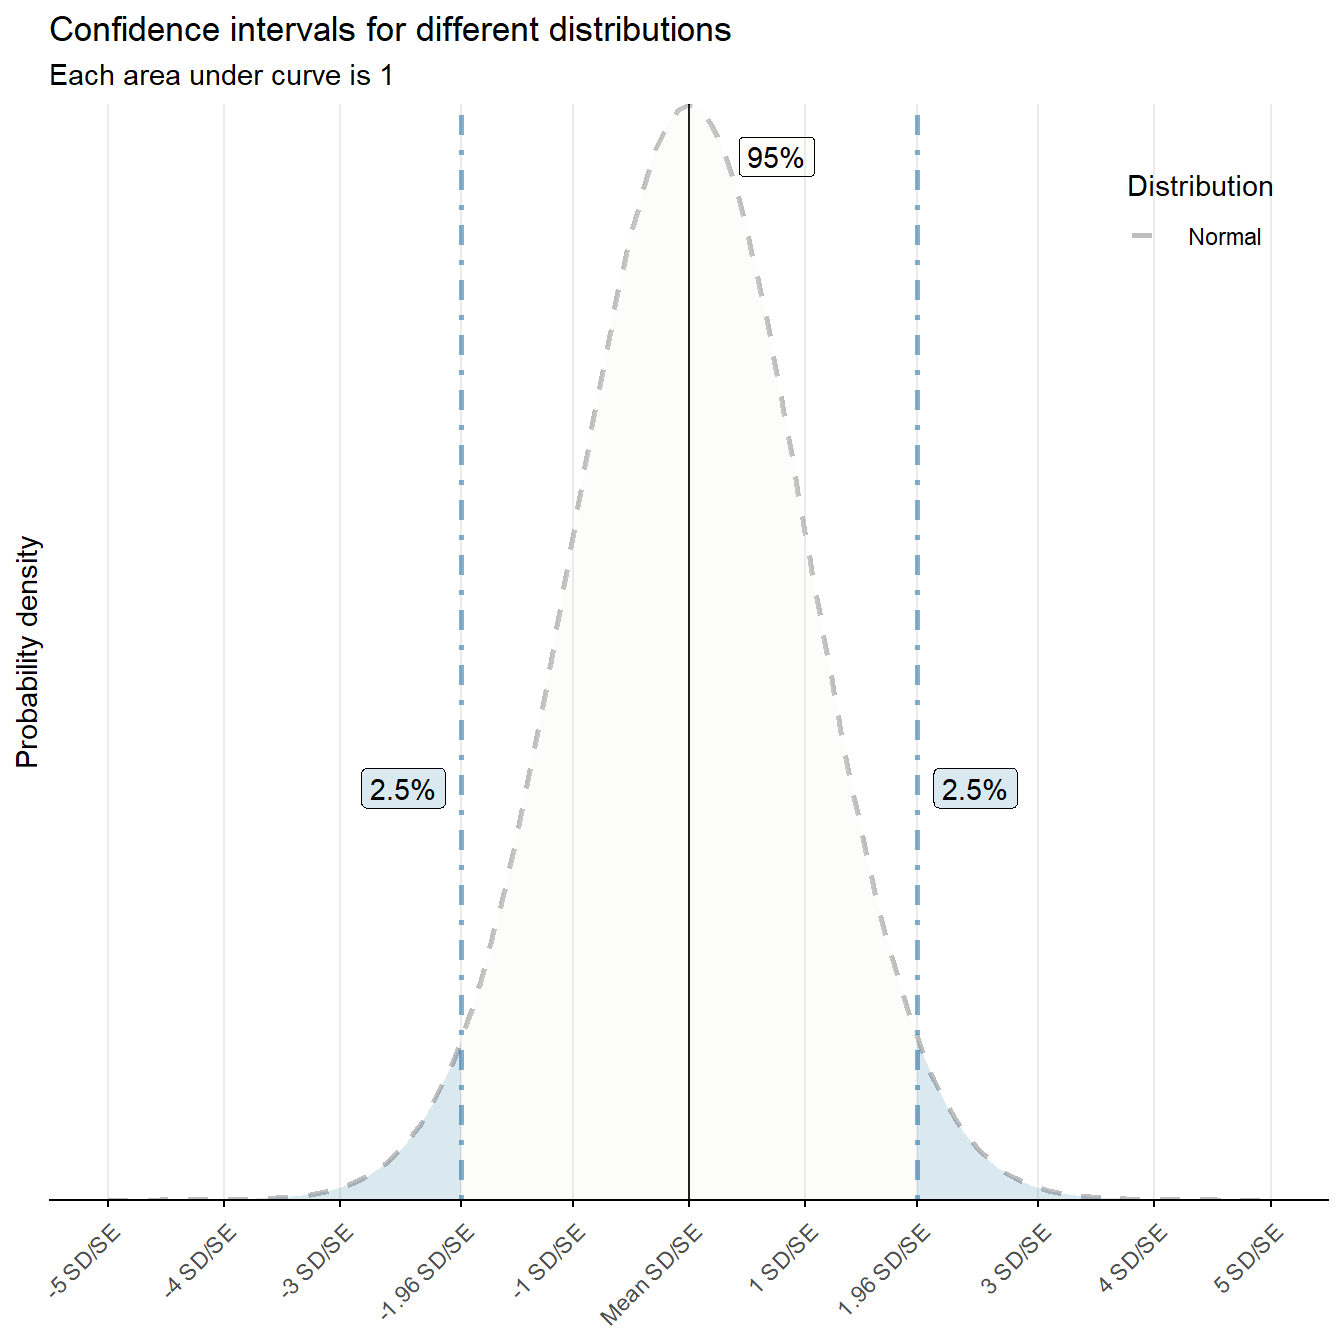
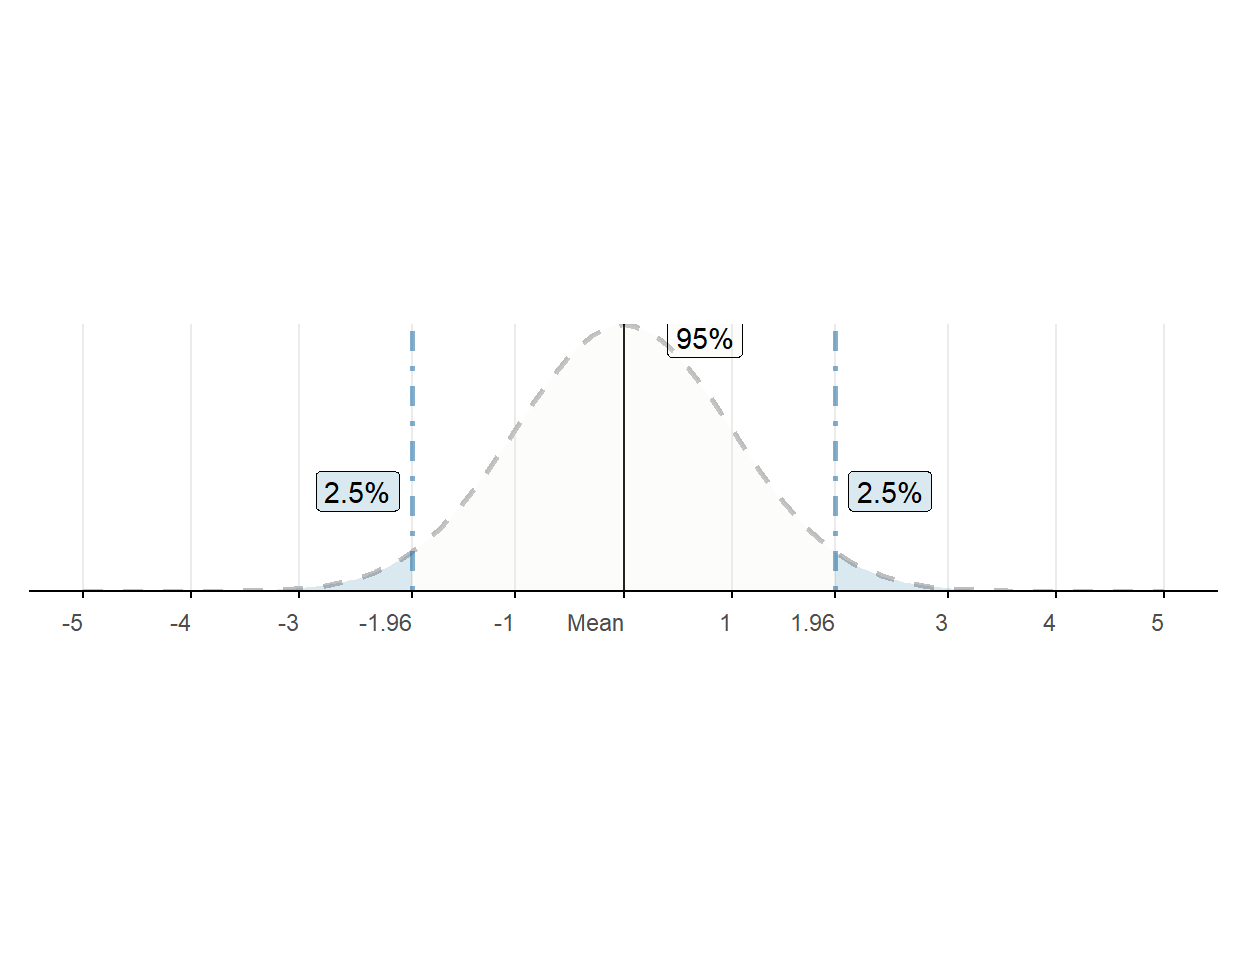
Within what number of \(\sigma\), exactly 95% of all observations are? Any ideas?
95% of HH are located within \(\pm 1.96 \sigma\).
an interval (a range), within which we can observe 95% of observations.
95% is the confidence level
95% confidence level is a convention. Go higher, not lower!
Warning
This definition only applies to the population mean.
Although the idea behind a confidence interval remains the same.
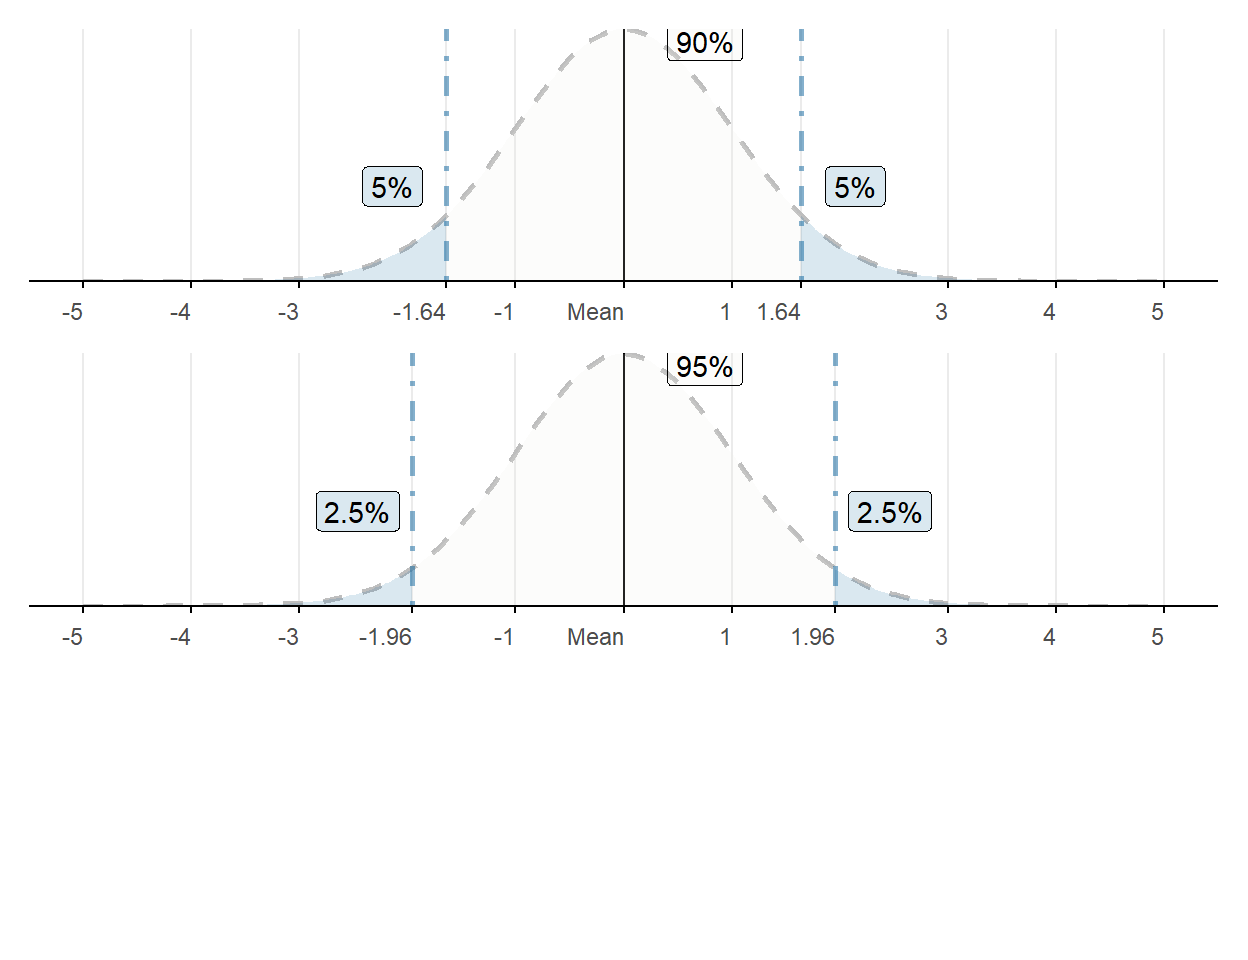
Is 90% confidence interval wider/slimmer than the 95% one?
99% vs 95%?


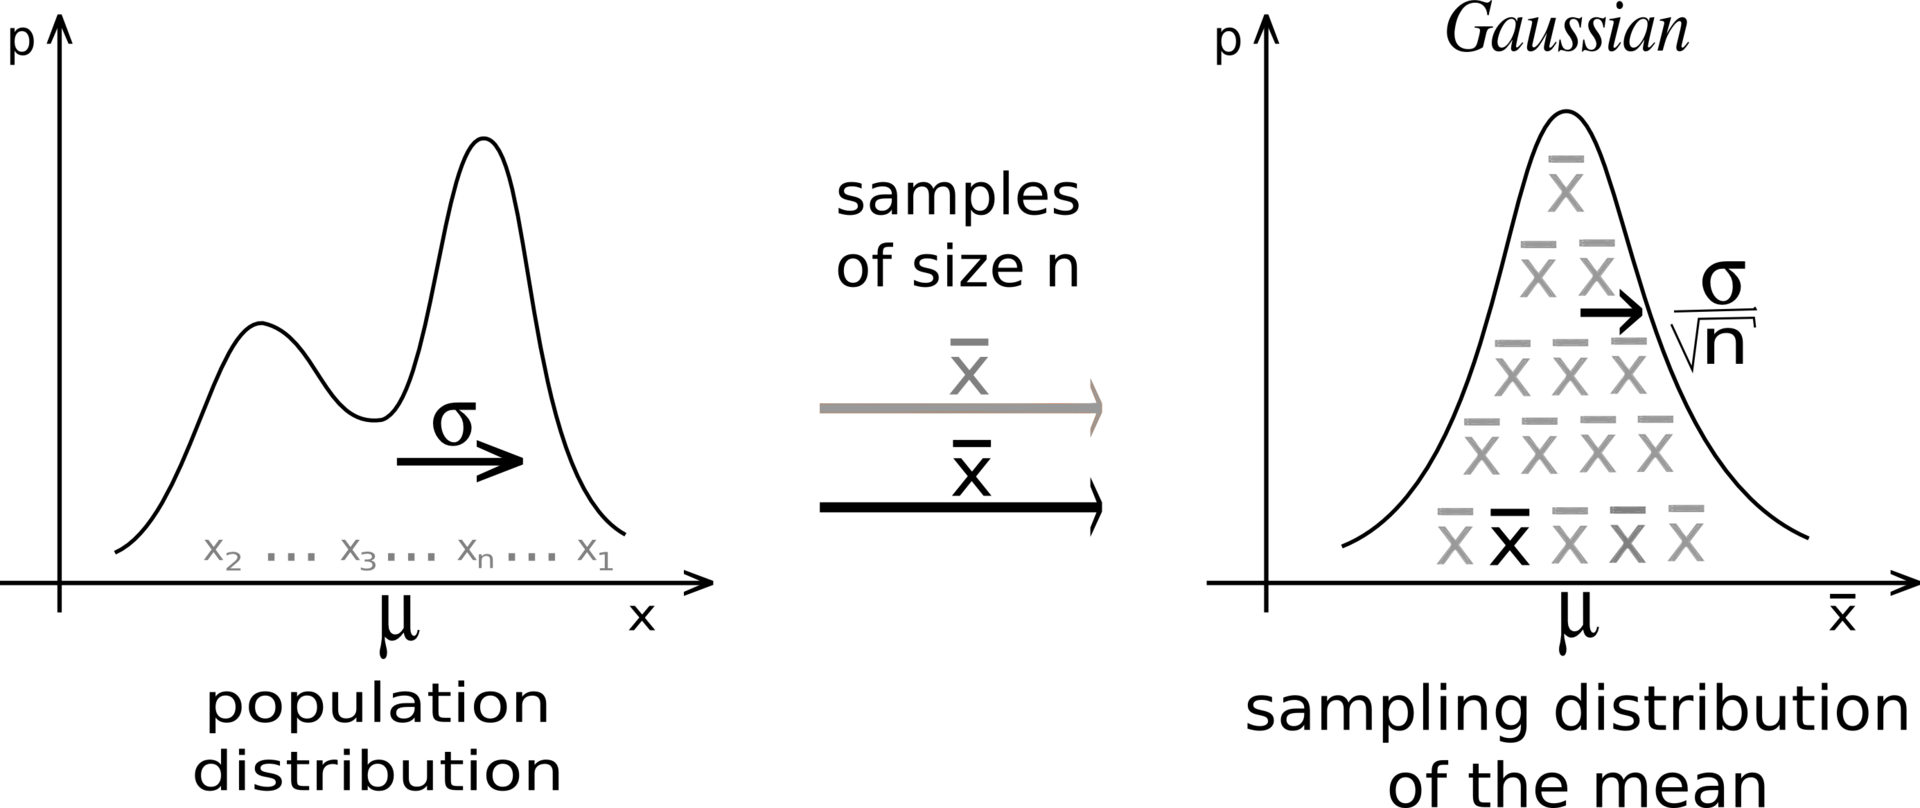
The CLT is the bridge that makes the transition from the population to a sample.
As the sample is used to estimate the population mean, the CLT says that:
almost any sample average
is approximately normally distributed,
with the accuracy of the approximation increasing as the sample size increases (Angrist and Pischke 2014, 39)
The estimate of the mean \(\hat{\mu}\) in the sample of the size \(n\)
tends to follow a normal distribution centered at the population’s mean \(\mu\),
with the standard error, \(\text{SE}(\hat{\mu})\) calculated based on the population’s standard deviation, \(\text{SE}(\hat{\mu}) = \sigma / \sqrt{n}\),
when two conditions are satisfied:
Independence. The sample is random.
Only for sample size below 30 obs (\(n < 30\)) Normality. The population is normally distributed.
See: (Diez et al. 2022)
In other words:
When our random sample is large enough
sample estimate of mean \(\hat{\mu}\) approximates the population mean \(\mu\):
with the standard error that depends on the \(\sigma\) (pop. SD) and the sample size (\(n\)):
Because the population’s SD (\(\sigma\)) is unknown, we rely on the sample to estimate:
the standard error:
\(\text{SE}(\hat \mu) = \sigma / \sqrt{n} \approx \hat{\text{SE}}(\hat \mu) = s / \sqrt{n}\),
where \(\sigma \approx s\);
alone with the estimate of mean: \(\hat{\mu} \approx \mu\);
SE is an estimate of the standard deviation in the sampling distribution of \(\hat{\mu}\).
\[\widehat{\text{SE}}(\hat{\mu}) = s / \sqrt{n}\]
Measures deviation (error) of the \(\hat{\mu}\) estimate, from the population parameter (\(\mu\)), accounting for the size of the sample (\(n\)).
“Error” implies that the estimate contains a random error, compared to the population parameter.
Not to be confused with the Sample Variance
With the sample size increasing to infinity:
standard error approaches to zero,
but the sample variance does not!
See the following online tools:
Supposed that we have a population of unknown distribution, and
we derive a random sample of a size \(n\) and
estimate sample mean \(\hat \mu\) and \(\text{SE}(\hat \mu)\)
The Confidence Interval is the range around the sample mean, within which there is a 95% (or 99%) chance of observing our population mean.
We need to know:
how the sample means are distributed,
when we repeat random sampling from the same population.
The CLT [is very instrumental because it] says:
sample means are distributed normally, and
are centered around the population mean,
when the sample size is large (infinite)
But random samples are finite and often small in size…
We use t-distribution (instead of the normal) to adjust for the finite sample size and
t-distribution helps us:
to find the probability that the true population mean is beyond \(\pm \text{SE} (\hat \mu)\) from the \(\hat \mu\), conversely
tells us how many \(\pm \text{SE} (\hat \mu)\) from the \(\hat \mu\) there is a 95% chance to observe the population mean for the sample of the size \(n\).


Sample estimates are less accurate when the size is small.
Therefore, for inference,
we use t-distribution instead of the normal.
t-scores instead of the z-scores

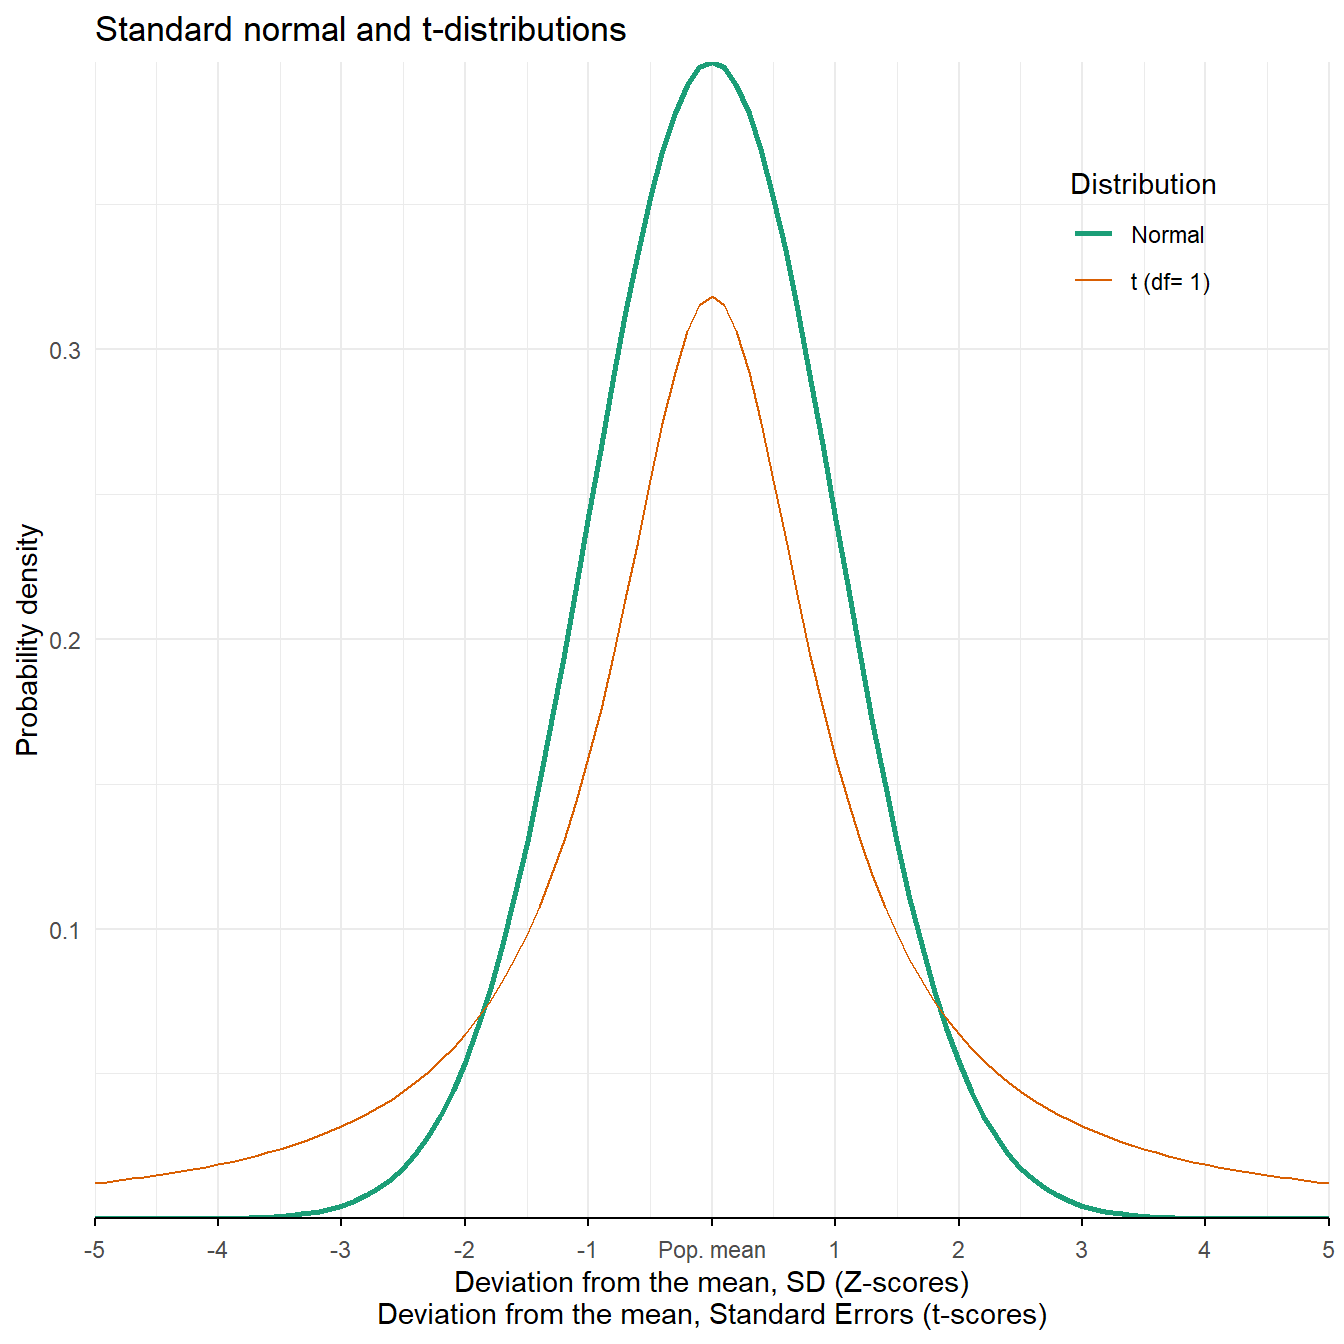
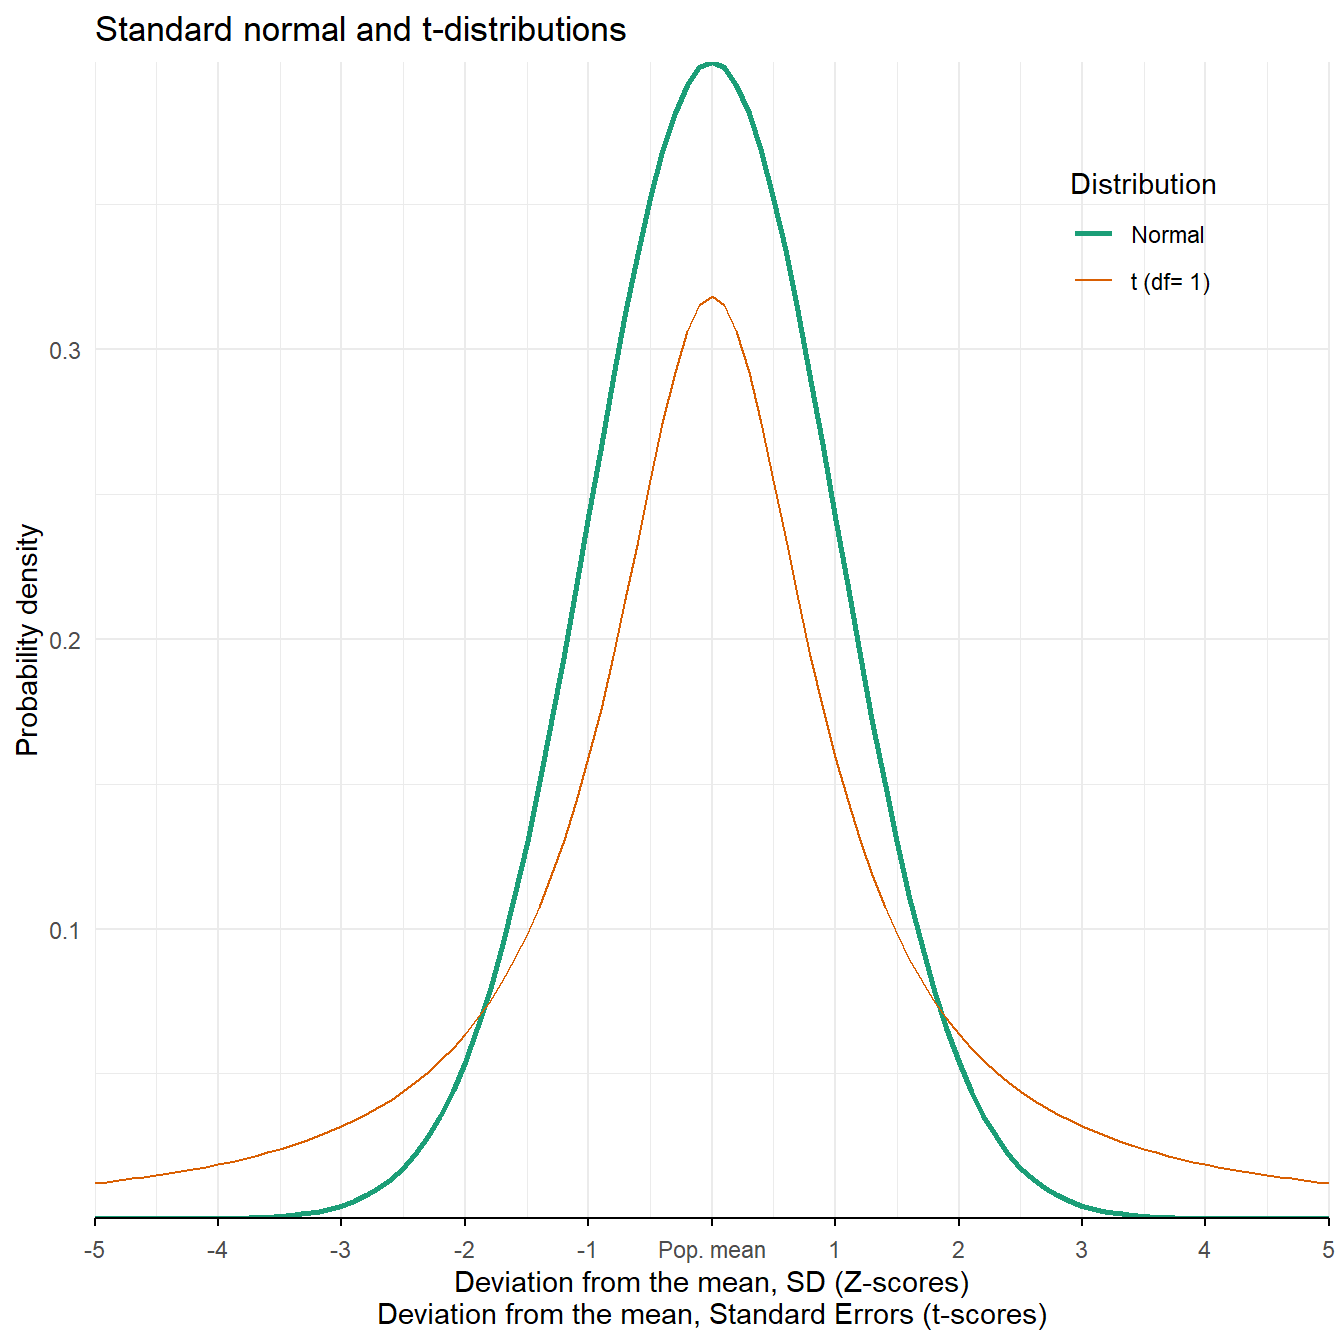
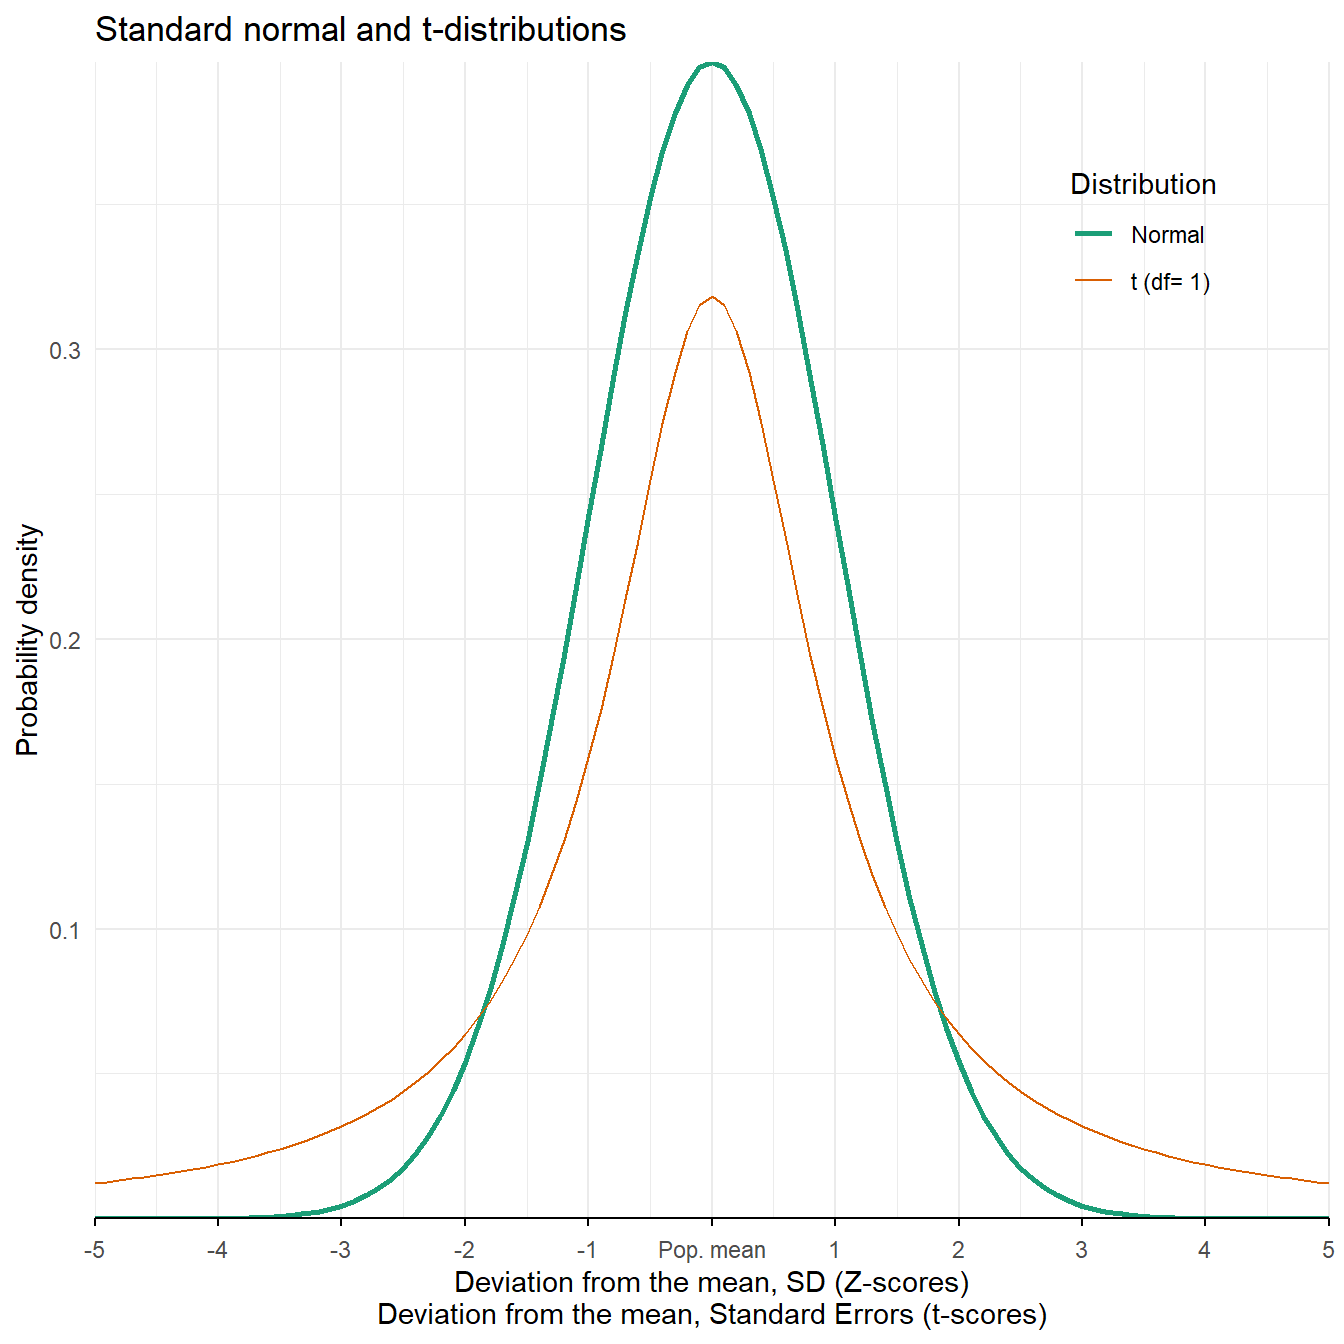
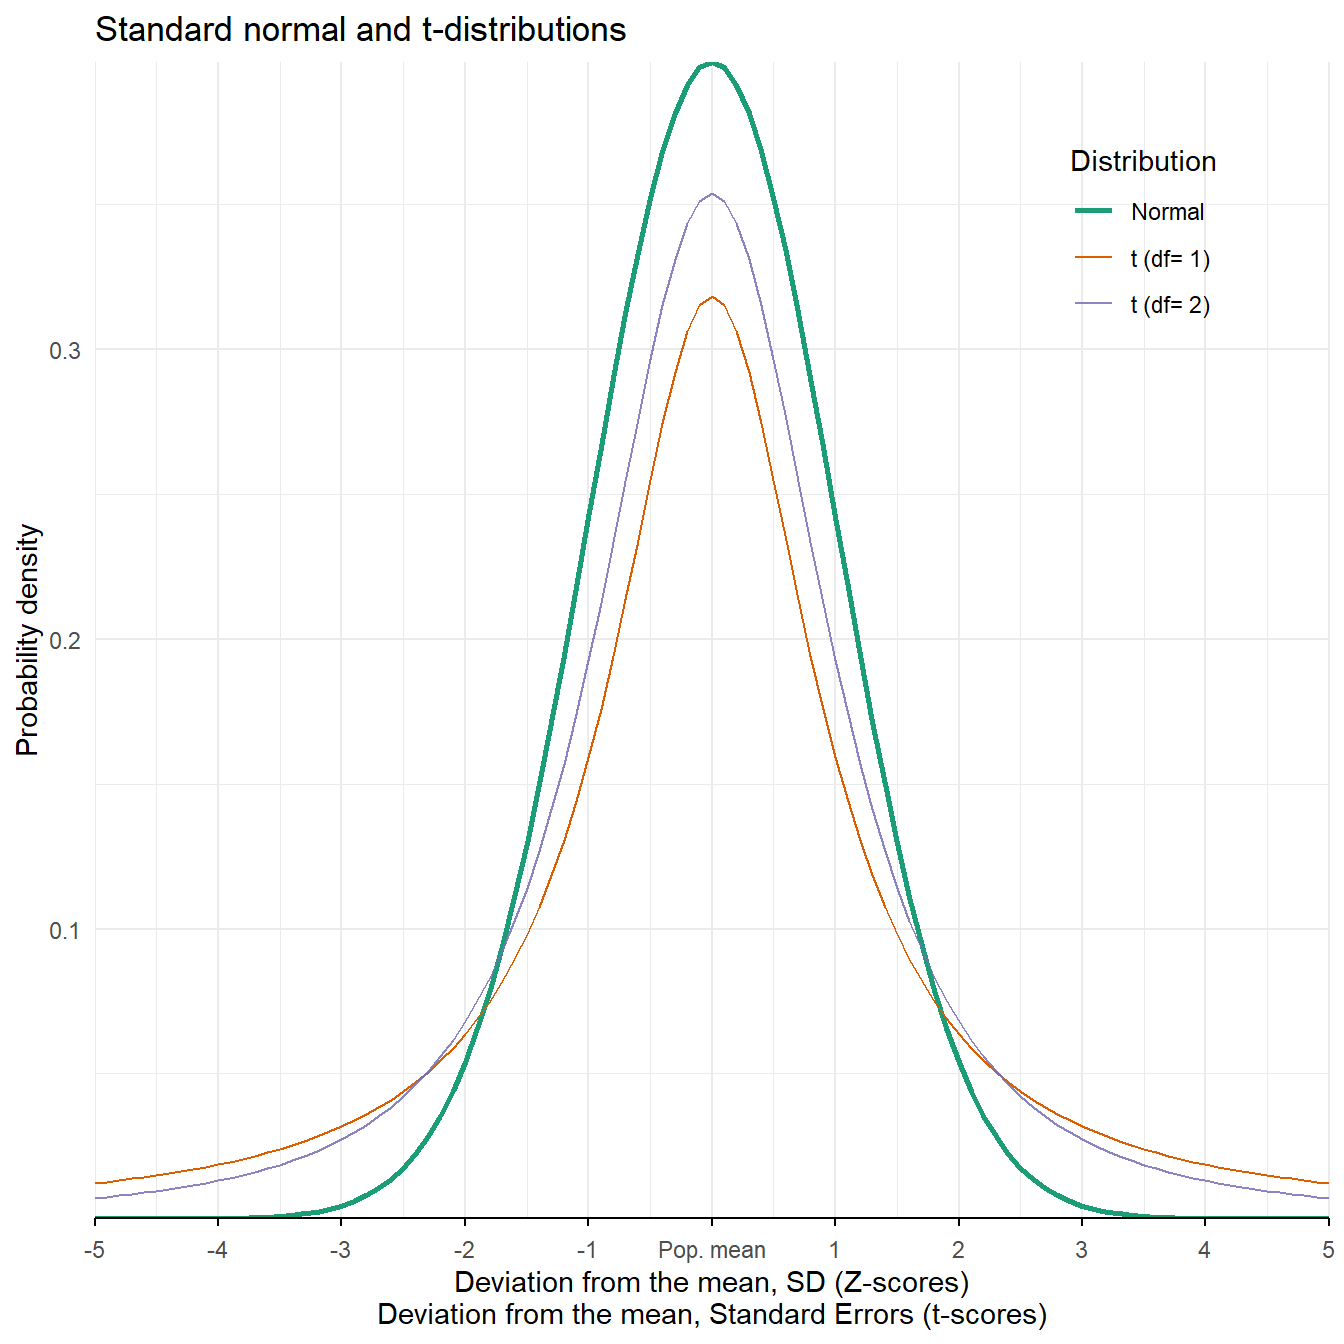
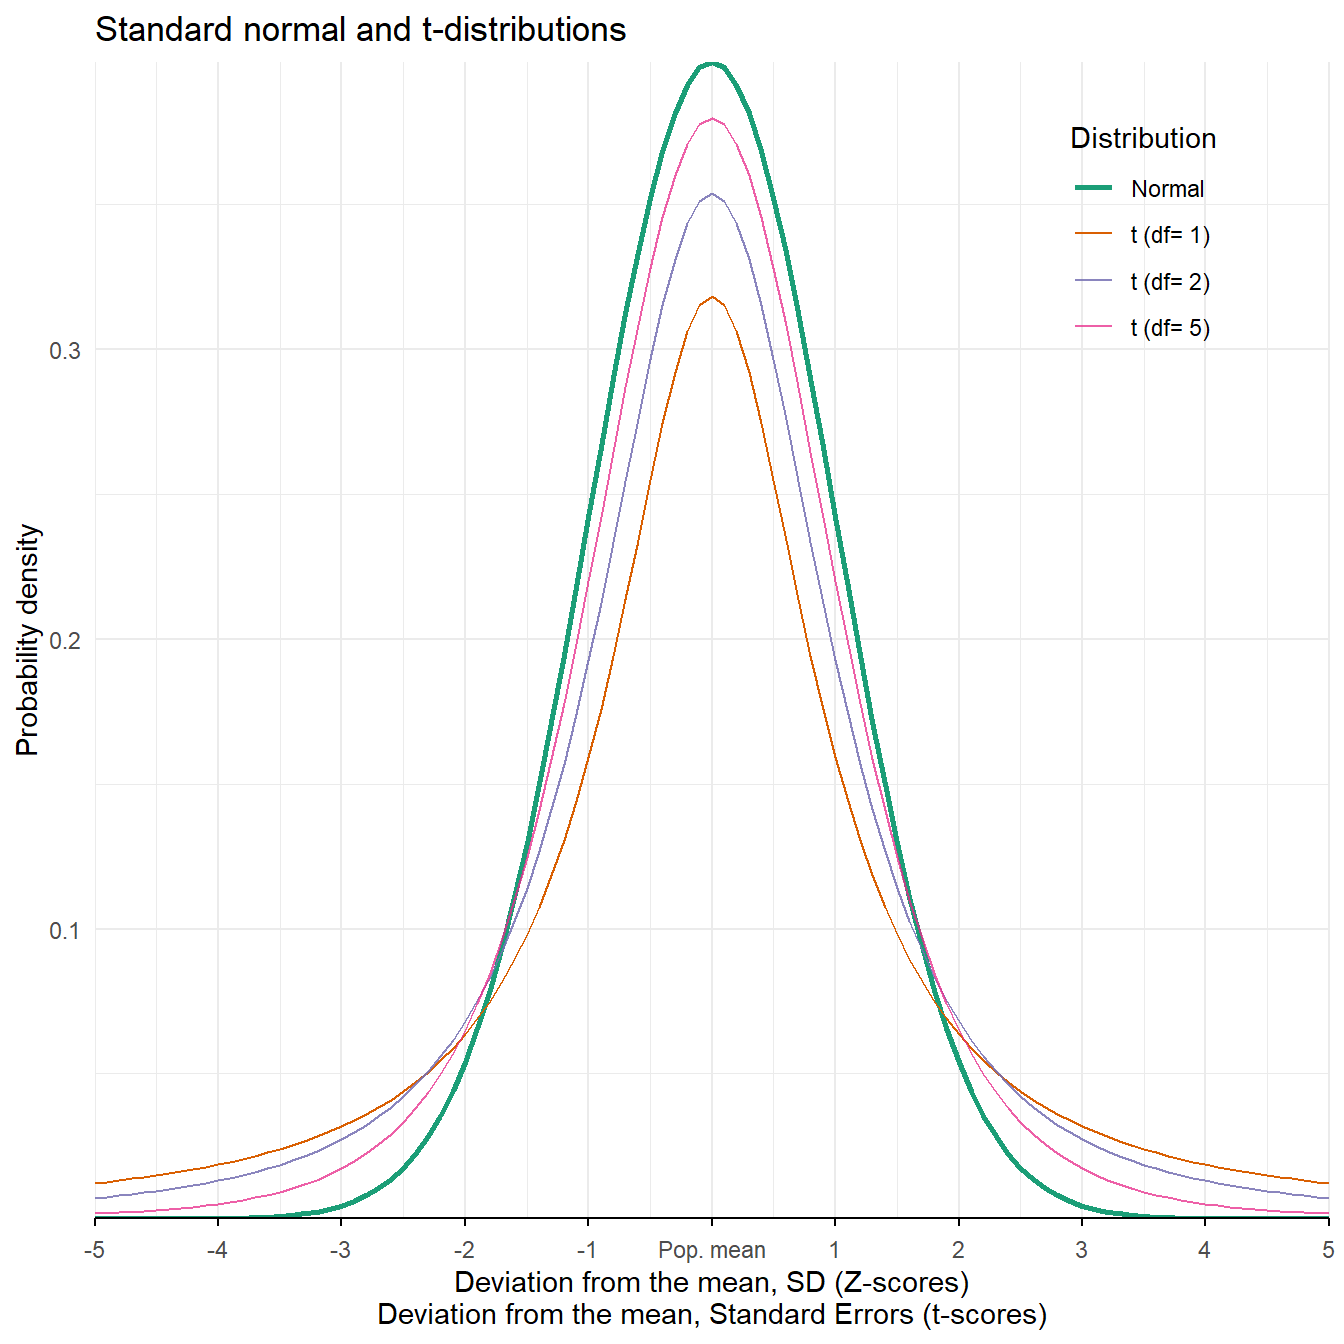
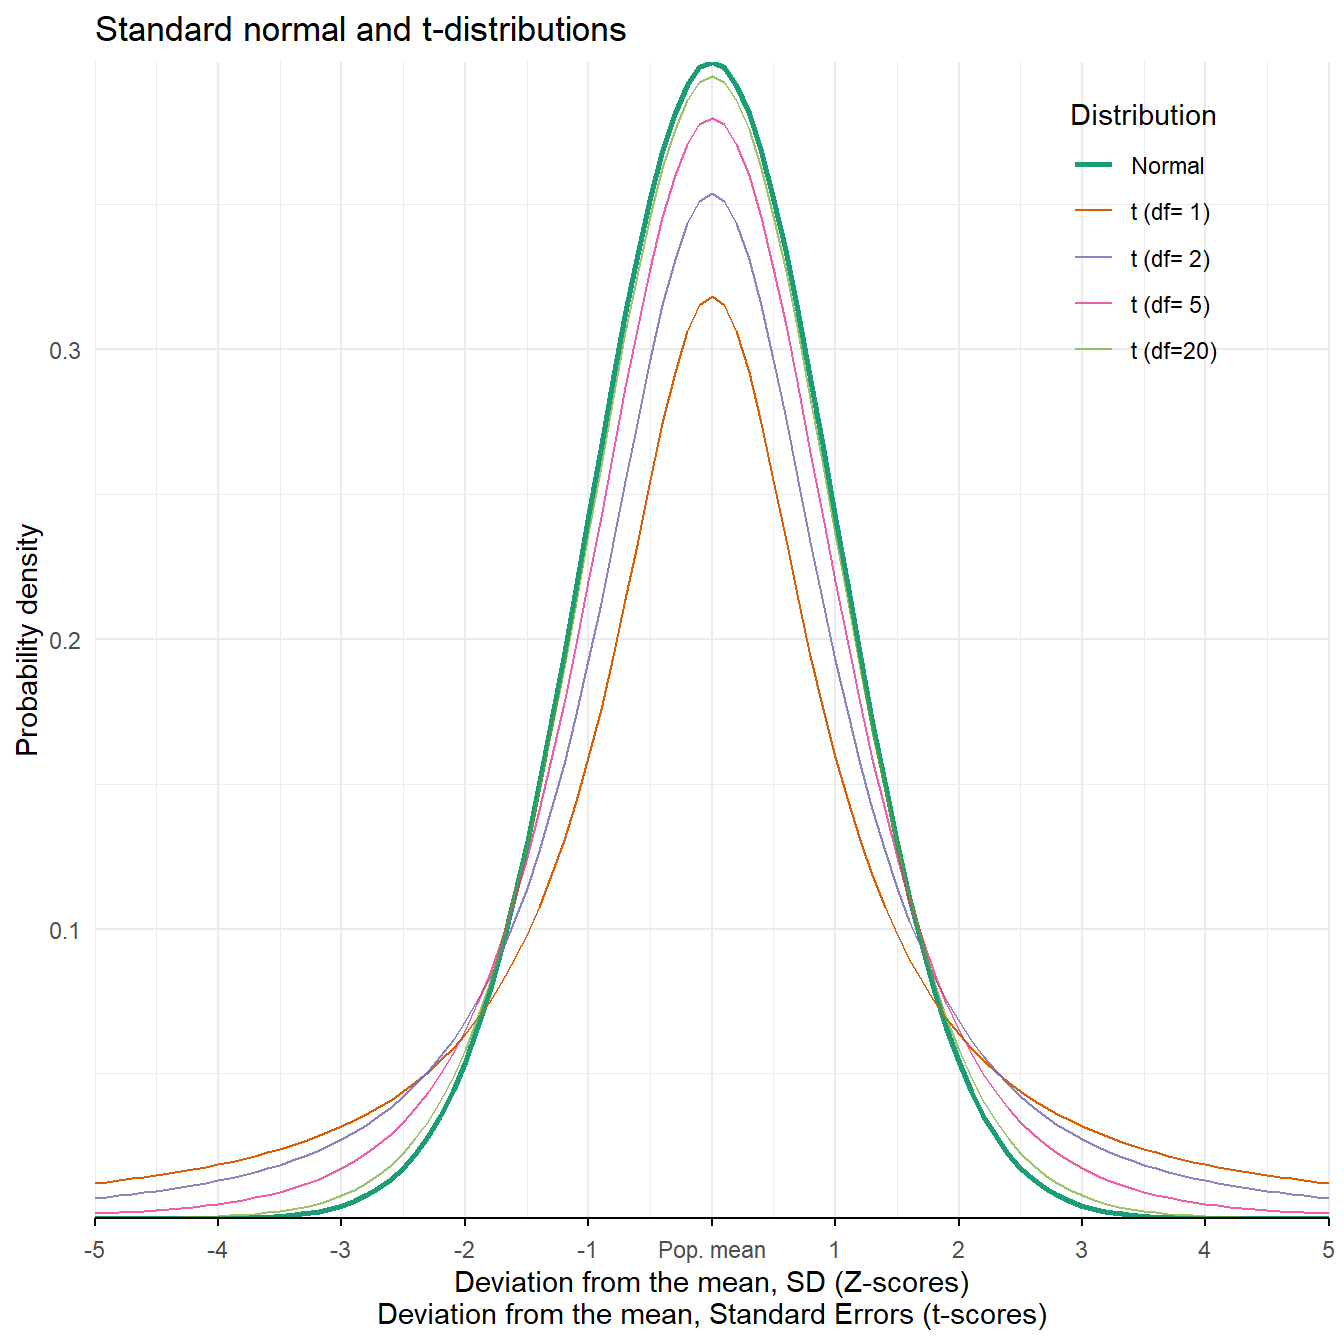
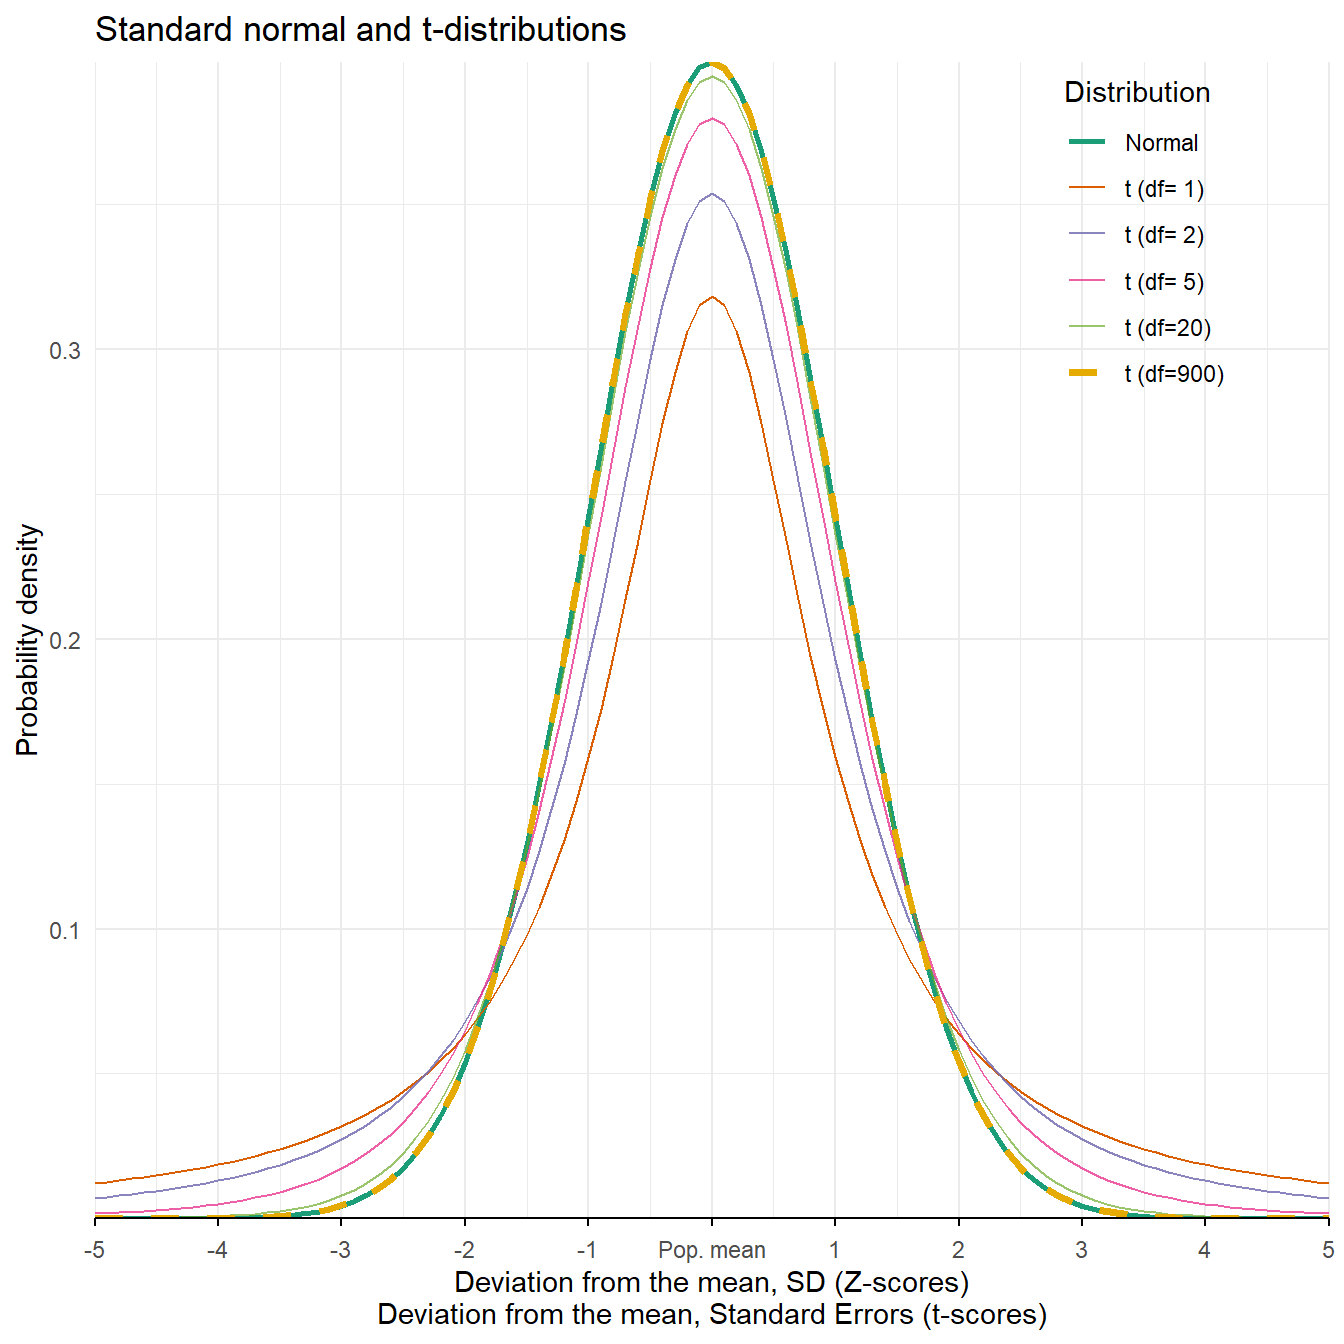
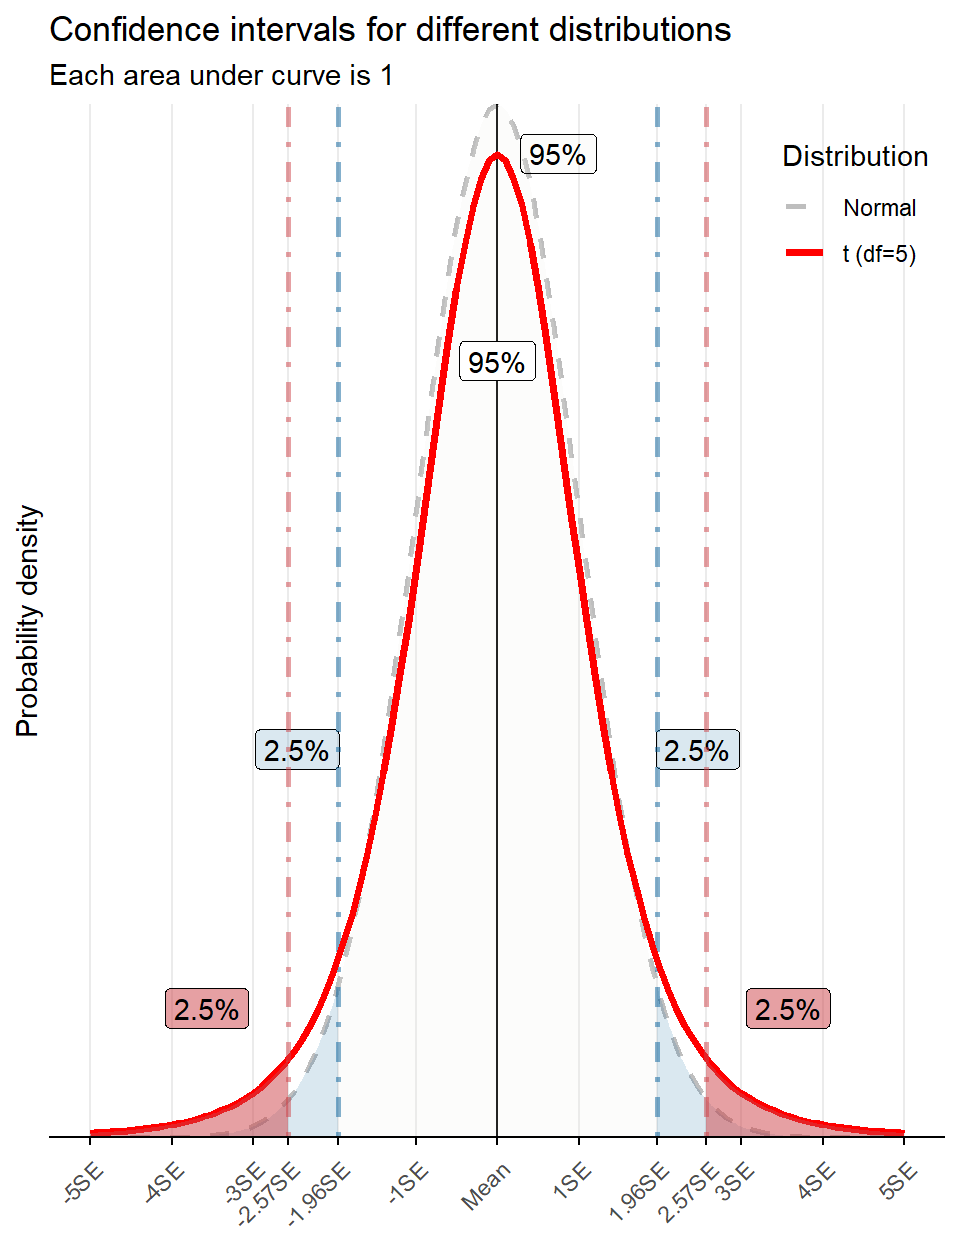
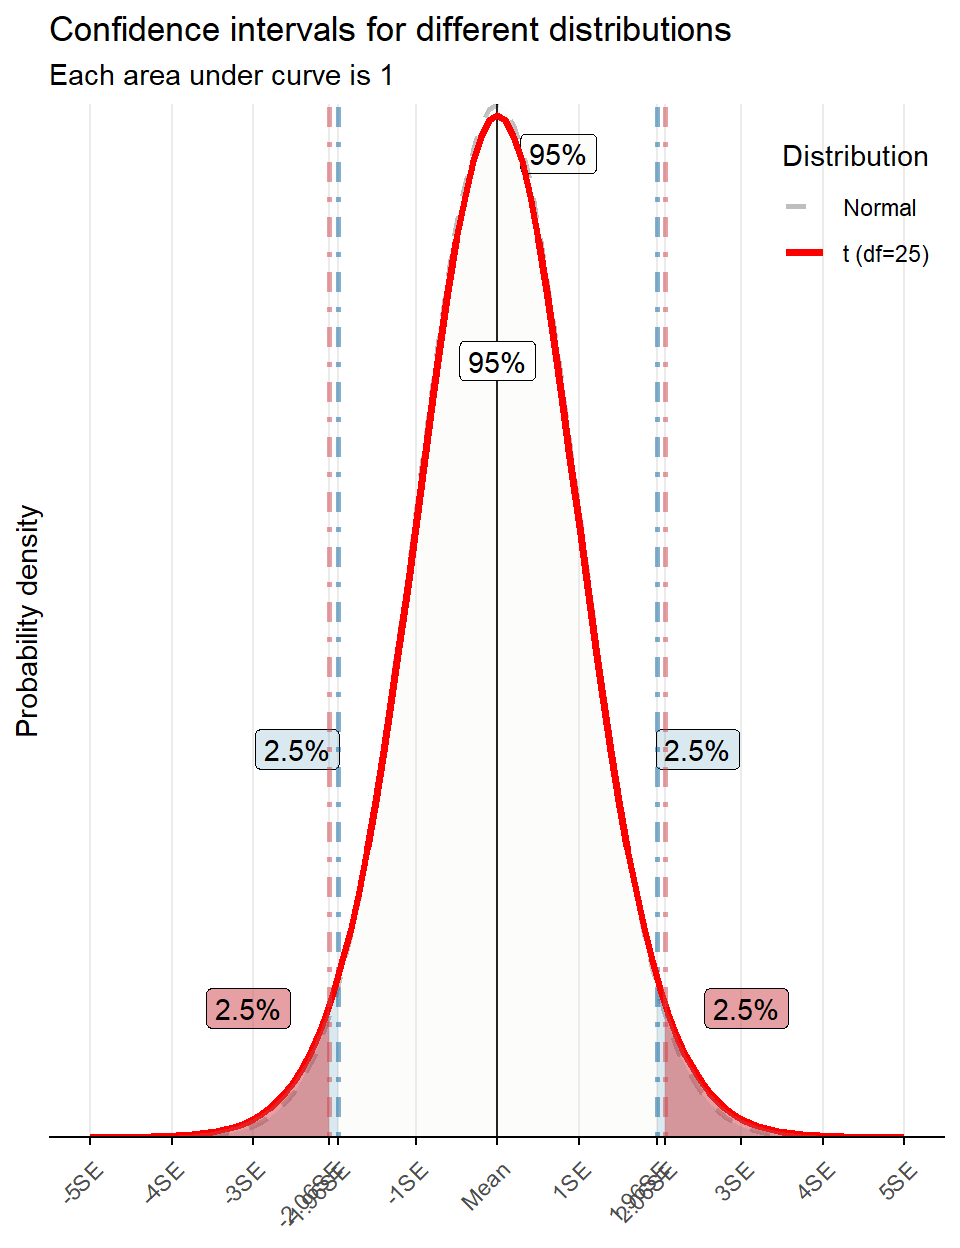
t-distribution has “thicker tails”:
the probability of observing a more extreme parameter, compared to the population value is larger;
the peak of t-distribution does not go too high;
observations are more likely to fall beyond 2SE away from the mean;
The shape of the t-distribution depends on degrees of freedom:
\(df = n - k\), where
\(n\) number of observations in the sample; \(k\) number of estimated parameters;
With an increase in \(df\),


For the population:
the standard normal distribution and Z-score provide
the confidence intervals, where we can observe 95% of actual observations.
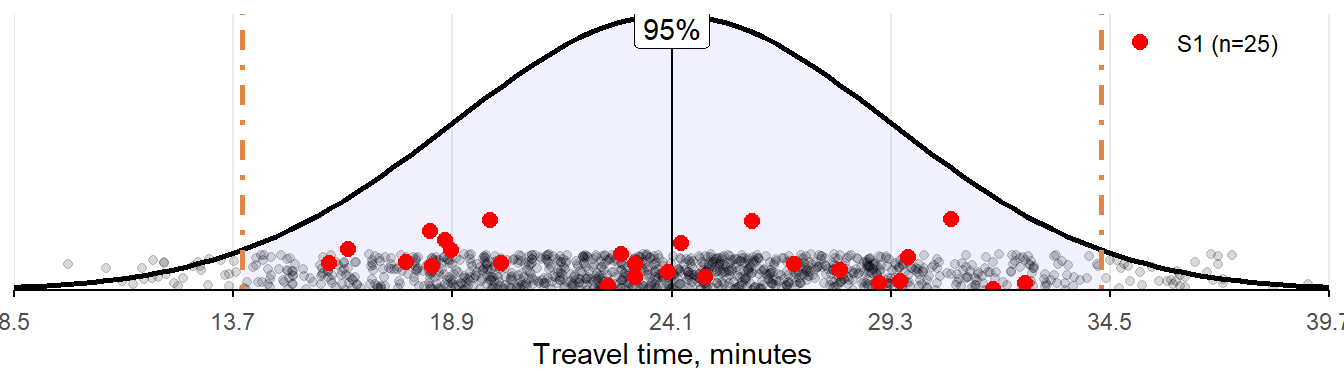
We have a population of travel times to schools.
Let us now:
1 Derive a random sample of N observations.
2 Estimate \(\hat \mu\) and \(\text{SE}(\hat \mu)\)
| Sample | \(n\) | \(\hat\mu\) | \(s\) | \(\text{SE}\) |
|---|---|---|---|---|
| S1 | 25 | 23.76 | 5.04 | 1.01 |
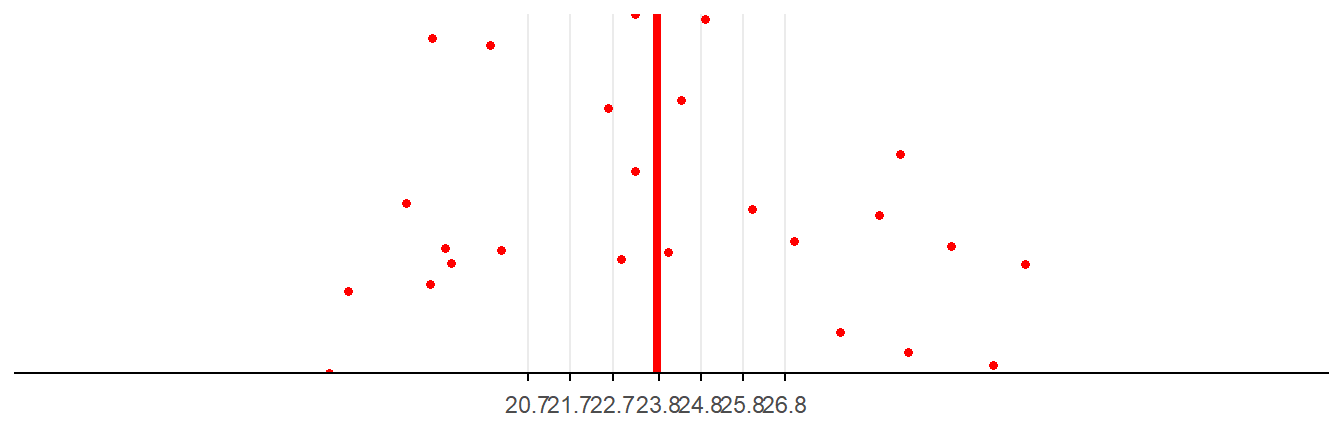
3 Construct the t-distribution for the sample estimates of the mean.
4 Compute 95% confidence intervals: chances that the population mean is within this range are 95%;
5 Conclude that 95% CI is the range where the population mean is 95% likely to be given our sample size, \(\hat \mu\) and \(\text{SE}(\hat \mu)\)
Now, let us repeat steps 1-5 for new samples of different sizes.
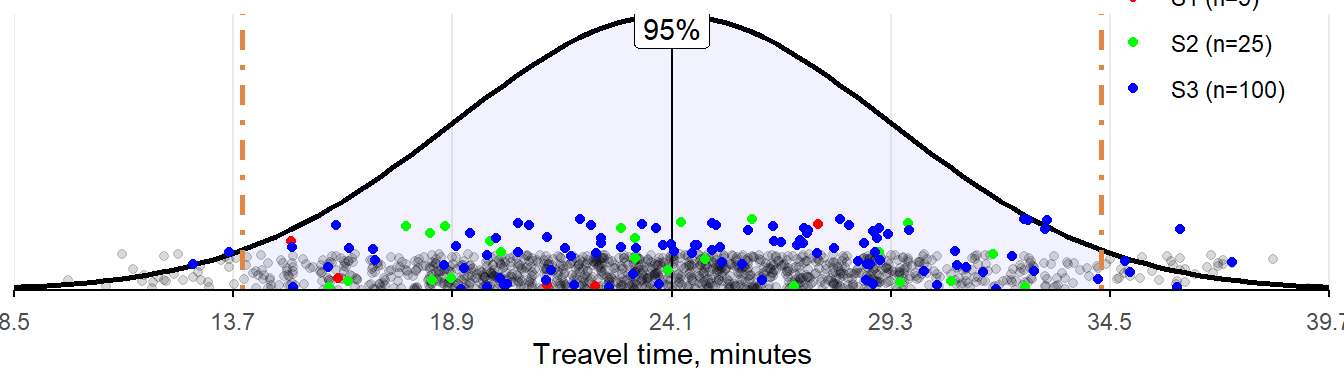
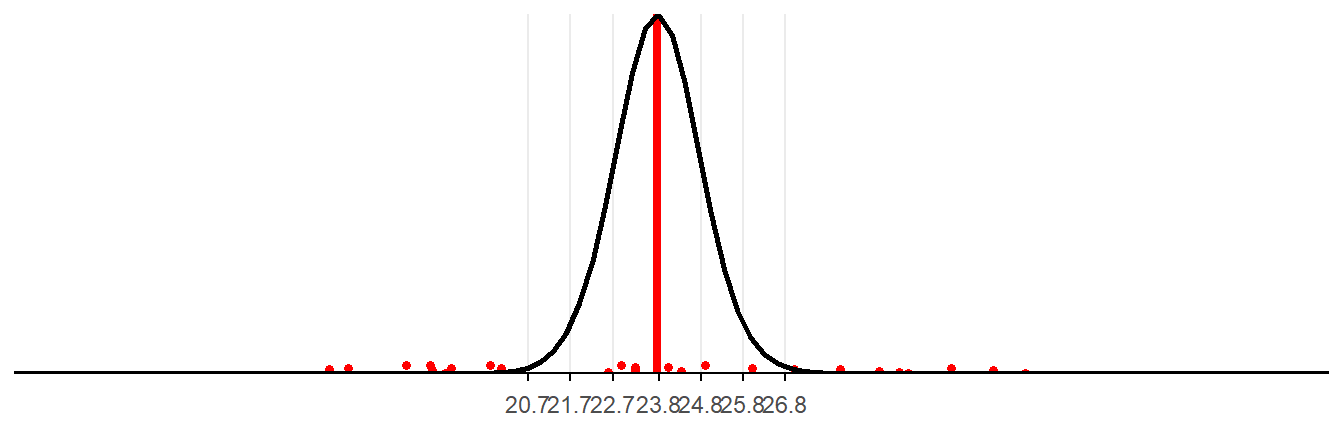
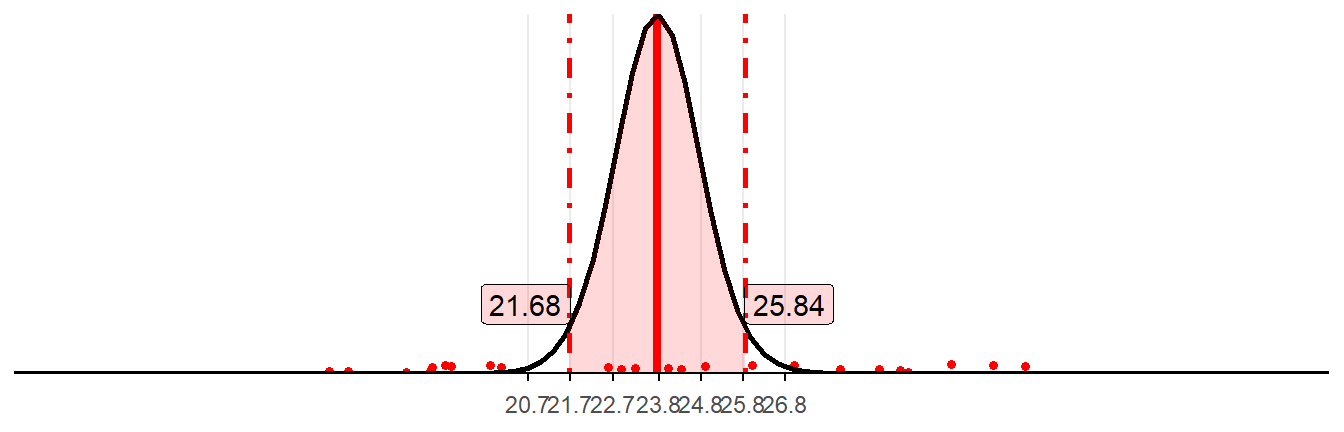
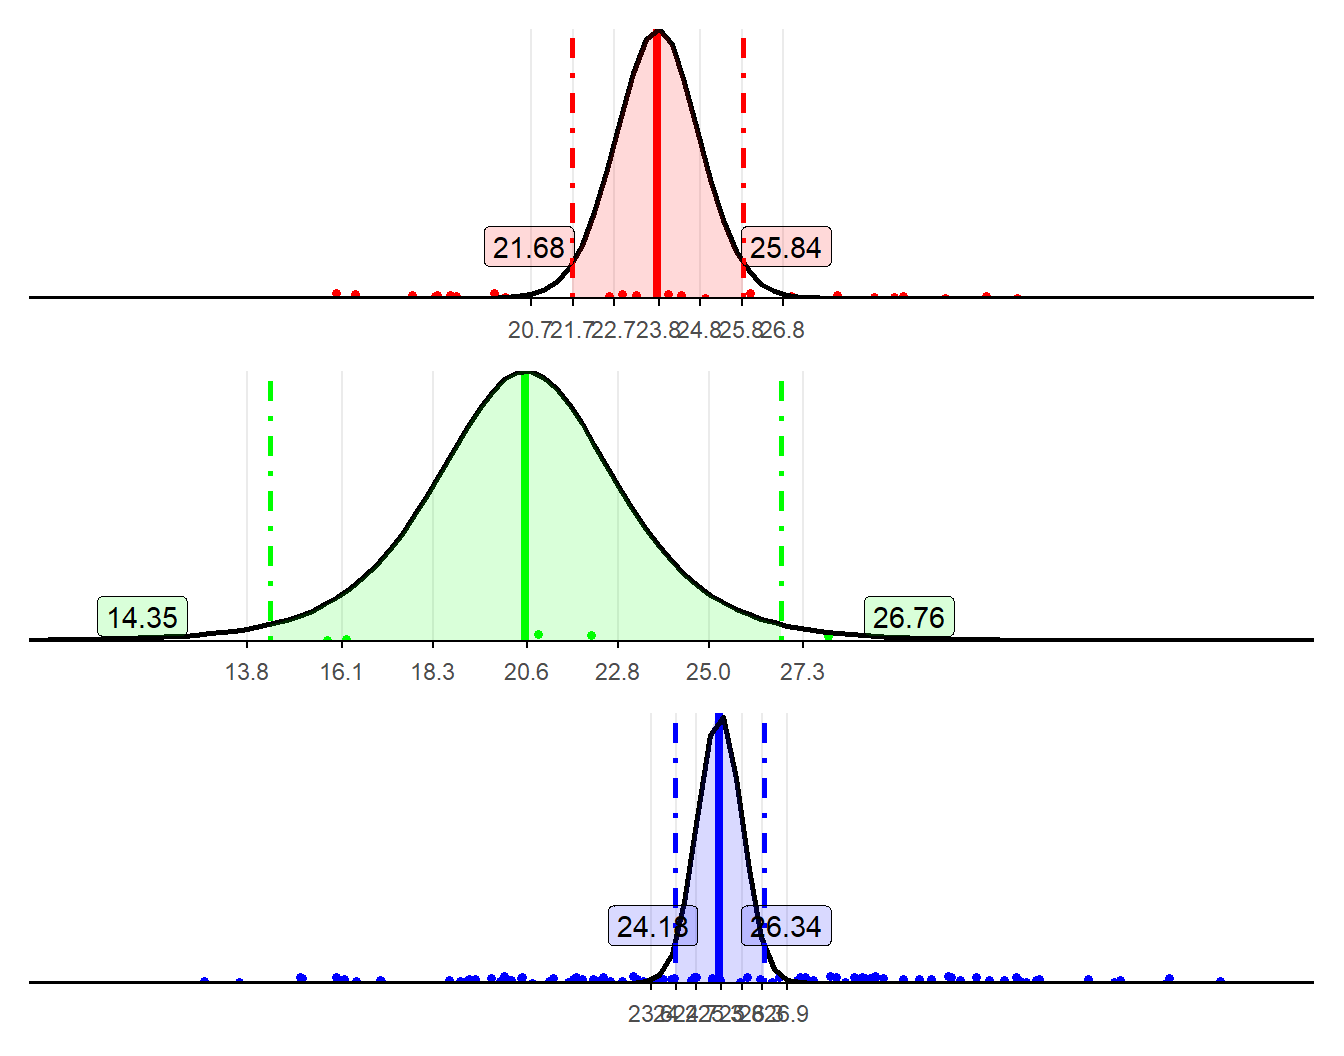
There are four samples of different size:
Each contains estimated parameters, which are different from the population.
| Sample | \(n\) | \(\hat\mu\) | \(s\) | \(\text{SE}\) |
|---|---|---|---|---|
| S1 | 25 | 23.76 | 5.04 | 1.01 |
| S2 | 5 | 20.55 | 5.00 | 2.24 |
| S3 | 100 | 25.26 | 5.43 | 0.54 |
| S4 | 1000 | 23.97 | 5.25 | 0.17 |
| Pop. | Inf | 24.10 | 5.20 | 0.00 |
Using t-distribution, for each sample of size \(n\) we compute a 95% confidence interval.
A 95% confidence interval provides a range, within which the population mean lies with the probability of 95%.
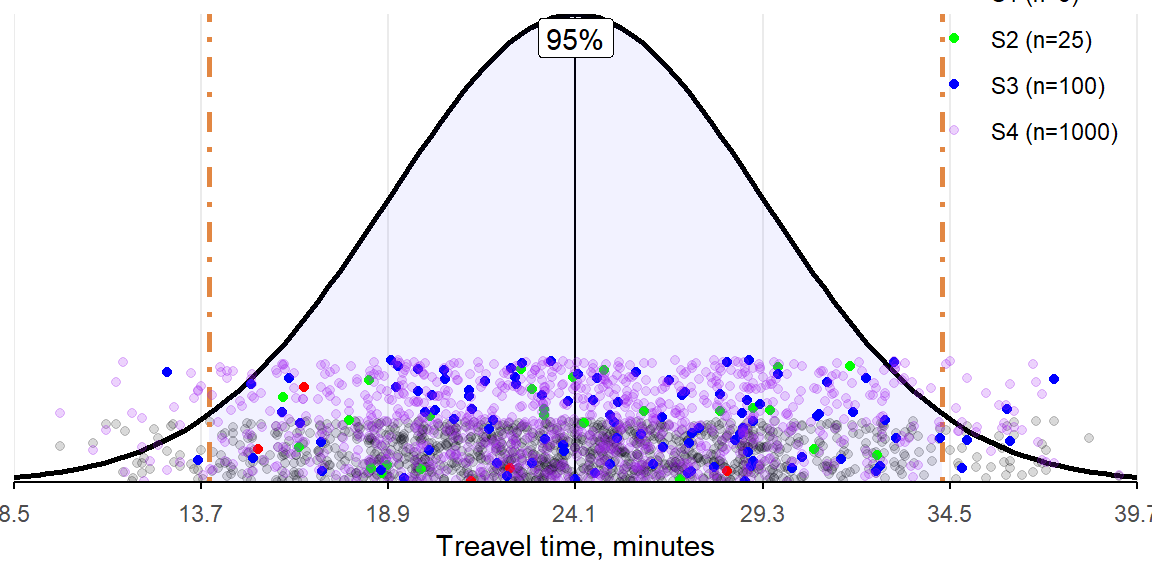
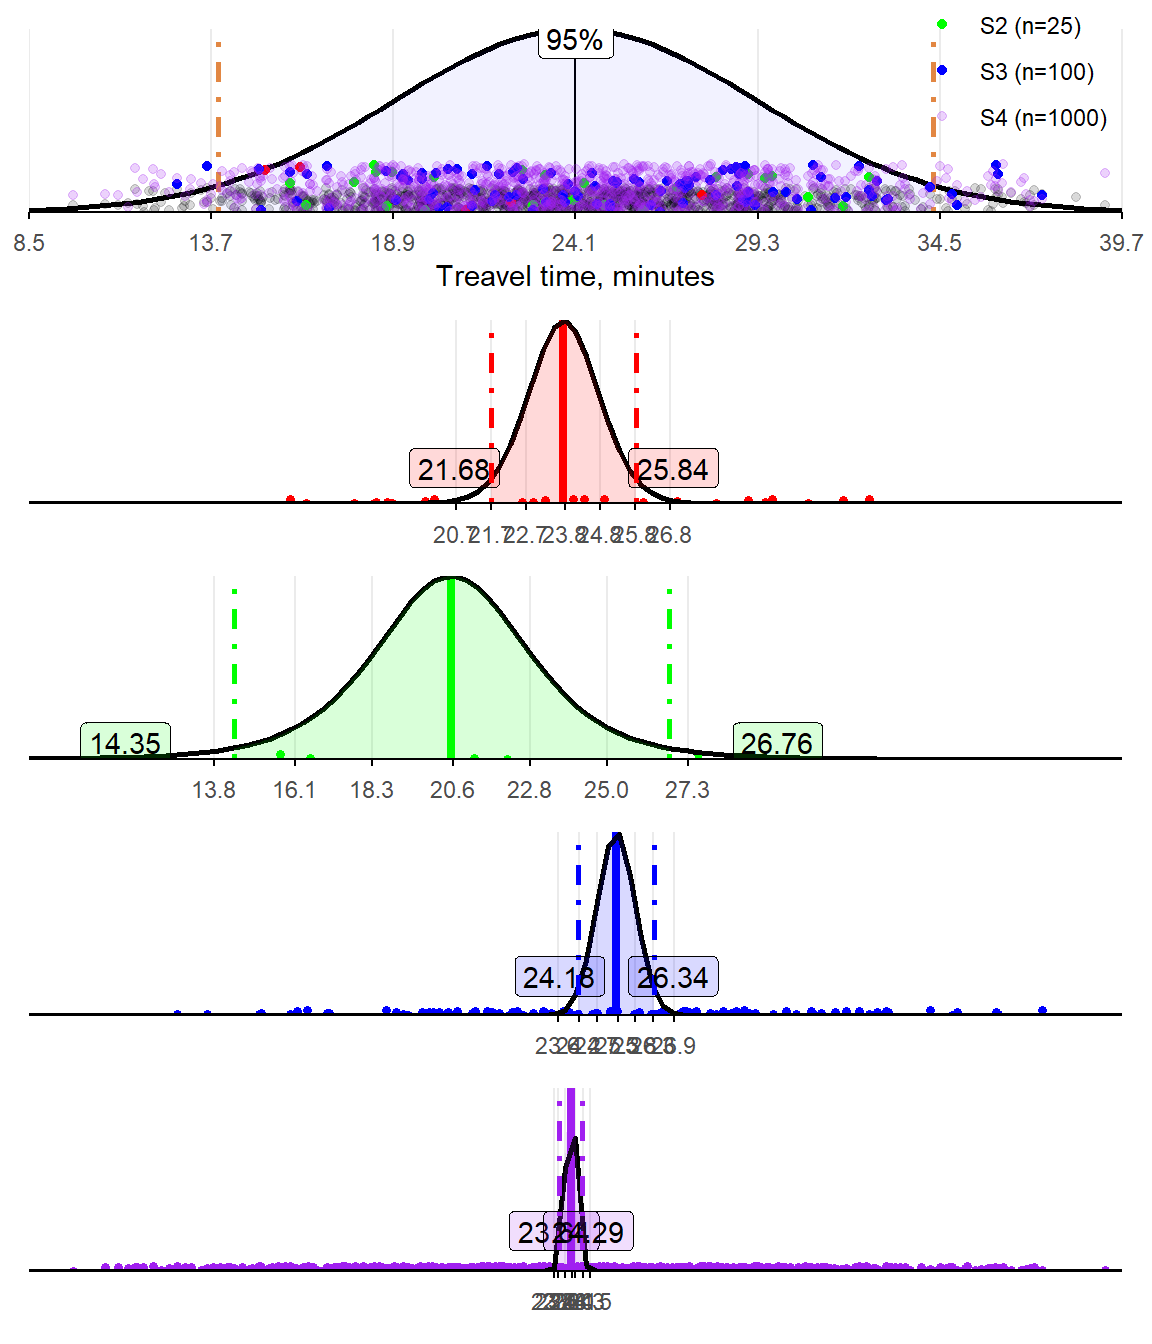
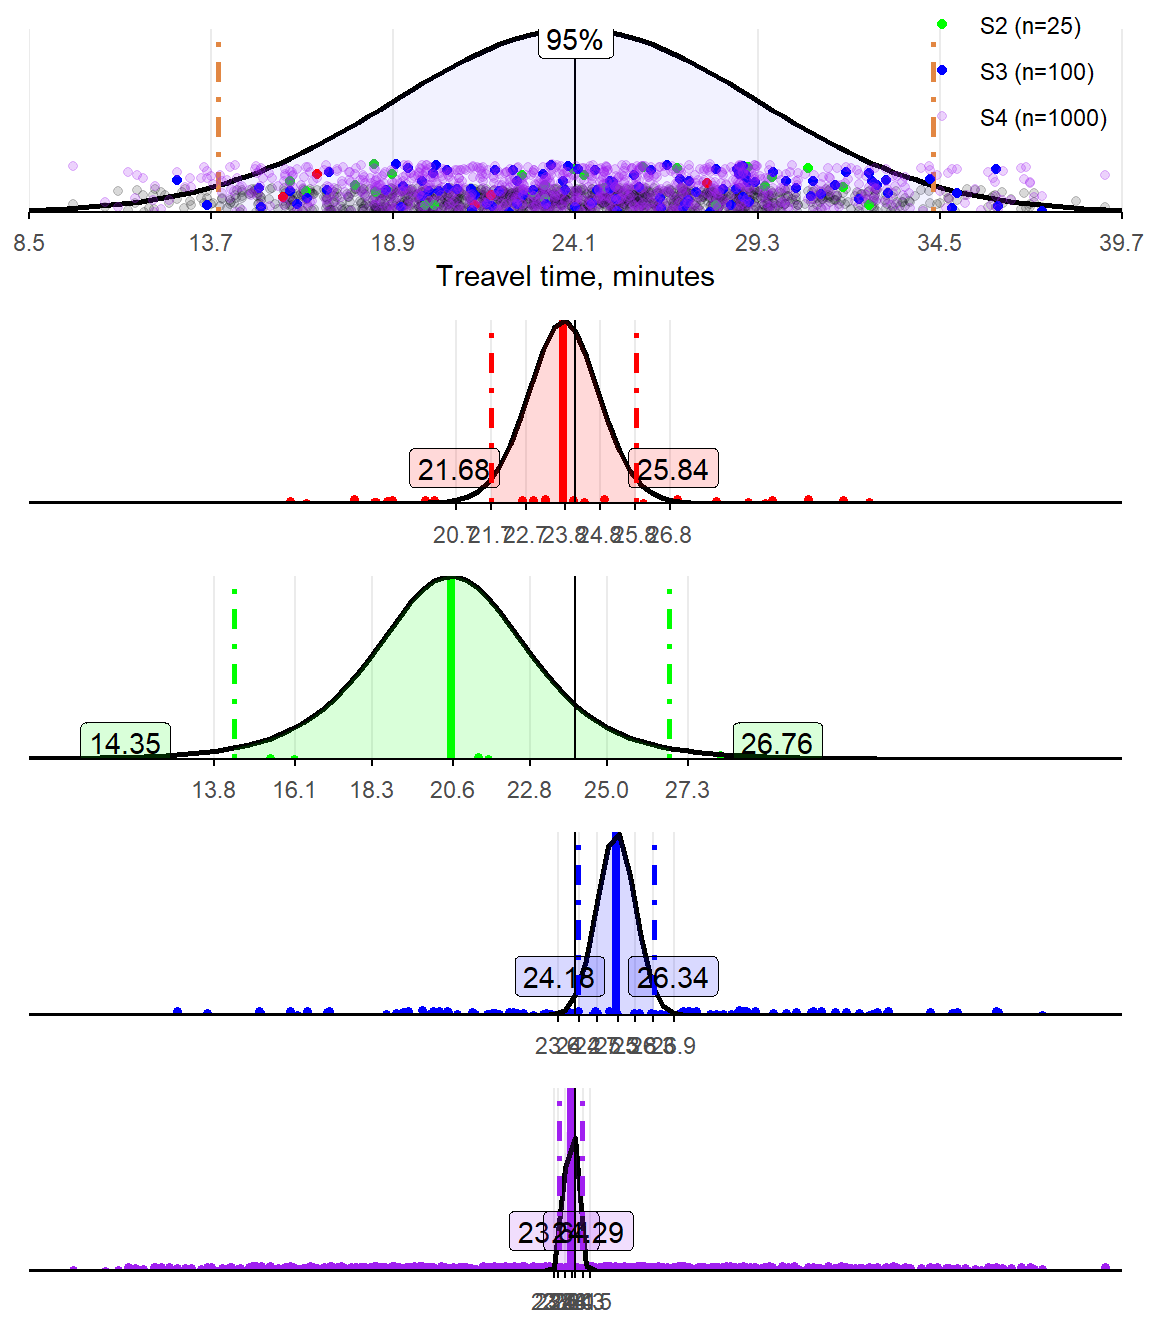
95% confidence interval of the mean is:
the range, within which we may find the population mean in 95% of random samples made from the same population.
we are 95% confident in observing the population parameter given the current sample size and \(df\)
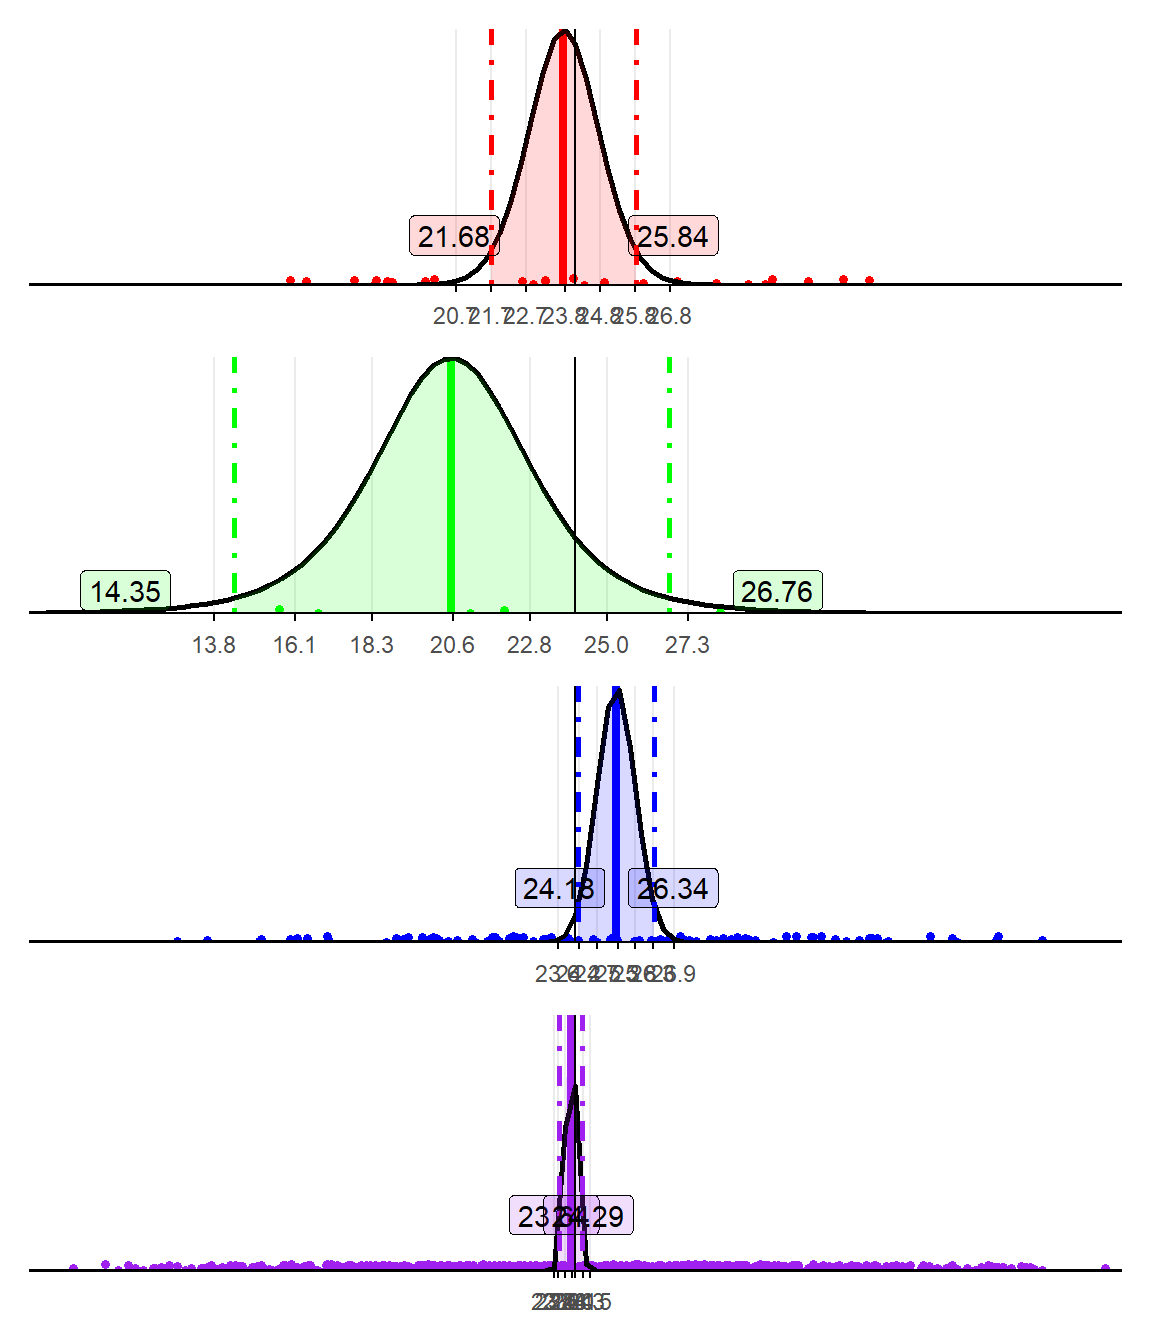
90%, 95%, and 99% are different levels of confidence;
Confidence level (CL) is the opposite of the level of significance \(\alpha\):
It is possible to compute confidence intervals at a different CL.
They will change in the same way as CI for the normally distributed variable shown before.
Source: https://rpsychologist.com/d3/ci/
\(P[...]\) - the probability that the population mean \(\mu\) lies within the lower and upper margins of the confidence interval:
\[P[\hat\mu - c_{df, (1-\alpha/2)} \cdot {\text{SE}}(\hat\mu) \leq \mu \leq \hat\mu + c_{df, (1-\alpha/2)} \cdot {\text{SE}}(\hat\mu) ] = 1 - \alpha\]
\[\text{CI} = \{\; \hat\mu - c_{df, (1-\alpha/2)} \cdot {\text{SE}}(\hat\mu)\; ; \; \hat\mu + c_{df, (1-\alpha/2)} \cdot {\text{SE}}(\hat\mu) \; \}\]
Sample of the size 5 is derived from the population. Estimated statistics for the travel time from HHs to school in minutes are:
| Sample | \(n\) | \(\hat\mu\) | \(s\) | \(\text{SE}\) |
|---|---|---|---|---|
| S2 | 5 | 20.55 | 5 | 2.24 |
Calculate the 95 confidence intervals for this mean.
\(df\) is: 4
\(c_{df, (1-\alpha/2)}\) is: \(c_{4, (1-0.05/2)} = 2.776\)
Lower bound is: \(20.55 - 2.24 * 2.776 = 14.331\)
Upper bound is: \(20.55 + 2.24 * 2.776 = 26.769\)
CI is: \([14.331 \; ; \; 26.769]\)
| df | 0.9 | 0.95 | 0.975 |
|---|---|---|---|
| 1 | 3.0777 | 6.3138 | 12.7062 |
| 2 | 1.8856 | 2.9200 | 4.3027 |
| 3 | 1.6377 | 2.3534 | 3.1824 |
| 4 | 1.5332 | 2.1318 | 2.7764 |
| 5 | 1.4759 | 2.0150 | 2.5706 |
| 6 | 1.4398 | 1.9432 | 2.4469 |
| 7 | 1.4149 | 1.8946 | 2.3646 |
| 8 | 1.3968 | 1.8595 | 2.3060 |
| 9 | 1.3830 | 1.8331 | 2.2622 |
| 15 | 1.3406 | 1.7531 | 2.1314 |
| 20 | 1.3253 | 1.7247 | 2.0860 |
| 25 | 1.3163 | 1.7081 | 2.0595 |
| 50 | 1.2987 | 1.6759 | 2.0086 |
| 100 | 1.2901 | 1.6602 | 1.9840 |
| 1000 | 1.2824 | 1.6464 | 1.9623 |
Sample of the size 25 is derived from the population. Variable measured travel time from HHs to school in minutes. Estimated statistics are:
| Sample | \(n\) | \(\hat\mu\) | \(s\) | \(\text{SE}\) |
|---|---|---|---|---|
| S1 | 25 | 23.76 | 5.04 | 1.01 |
Calculate the 99 confidence intervals for this mean.
\(df\) is: 4 \(c_{4, (1-0.01/2)}\) is: 2.064
Lower bound is: \(23.76 - 1.01 * 2.064 = 21.675\)
Upper bound is: \(23.76 + 1.01 * 2.064 = 25.845\)
CI is: \(21.675 \; ; \; 25.845\)
| df | 0.975 | 0.99 | 0.995 |
|---|---|---|---|
| 1 | 12.7062 | 31.8205 | 63.6567 |
| 2 | 4.3027 | 6.9646 | 9.9248 |
| 3 | 3.1824 | 4.5407 | 5.8409 |
| 4 | 2.7764 | 3.7469 | 4.6041 |
| 5 | 2.5706 | 3.3649 | 4.0321 |
| 6 | 2.4469 | 3.1427 | 3.7074 |
| 7 | 2.3646 | 2.9980 | 3.4995 |
| 8 | 2.3060 | 2.8965 | 3.3554 |
| 9 | 2.2622 | 2.8214 | 3.2498 |
| 15 | 2.1314 | 2.6025 | 2.9467 |
| 20 | 2.0860 | 2.5280 | 2.8453 |
| 25 | 2.0595 | 2.4851 | 2.7874 |
| 50 | 2.0086 | 2.4033 | 2.6778 |
| 100 | 1.9840 | 2.3642 | 2.6259 |
| 1000 | 1.9623 | 2.3301 | 2.5808 |
Open intro:
Khan academy:
Question: Does the drug increase sleeping time at the 5% level of significance?
Data:
The estimated parameters are:
| vars | n | mean | sd | se |
|---|---|---|---|---|
| 1 | 10 | 0.75 | 1.78901 | 0.5657345 |
Can we conclude that the mean is different from zero?
Because:
the mean difference could result from a small sample or sample’s variation.
to conclude about the population, we need to take into account the sample distribution.
We need to perform a Statistical Hypothesis Testing with:
The one-sample two-sided t-test.
Compare mean to a zero;
One-sample t-test
mu specified (or zero if not specified);We come back to the travel time example.
Travel time example:
Two random samples are derived from the population:
Treatment, where (CCTs) were provided;
Control, where no CCT was provided;
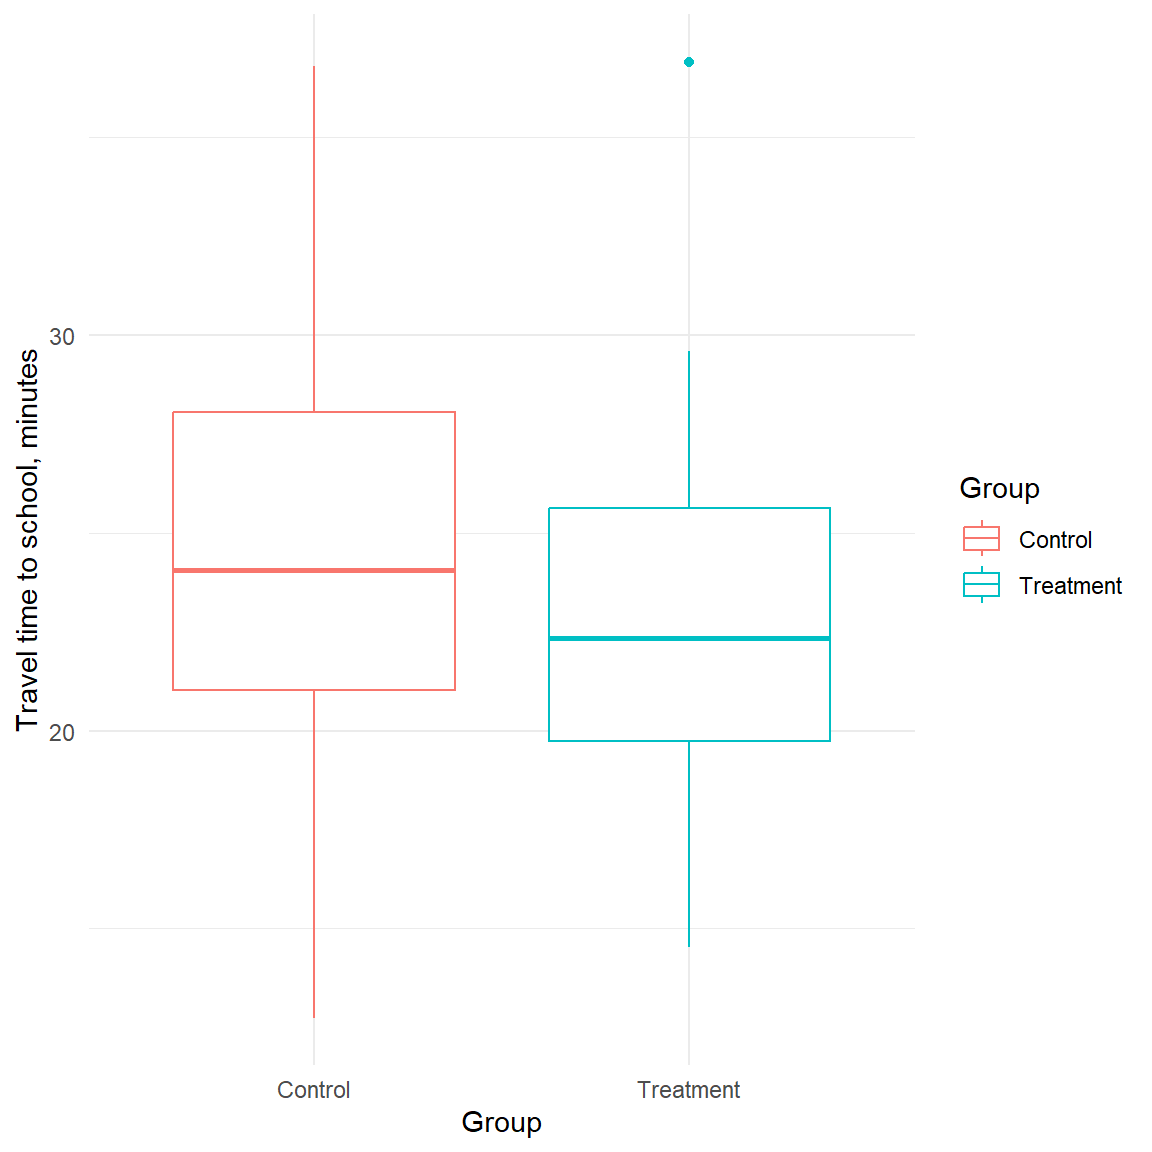
We want to establish that the mean travel times of these two groups are similar on average.

From the plot, we observe:
Medians are slightly different but they overlap within the boxes (for 50% of all observations)
Variances are different based on the whiskers. The presence of an outlier in the treatment may indicate that groups have similar variances, but the small sample size does not perfectly represent it.
We may consider using a t-test for two samples with unequal variances.

| Group | \(n\) | \(\hat\mu\) | \(s\) | \(\text{SE}\) |
|---|---|---|---|---|
| Control | 31 | 24.46 | 5.52 | 0.99 |
| Treatment | 33 | 23.01 | 4.64 | 0.81 |
Is there any difference between treatment and control?
Absolute numbers are different.
Given that these are two samples, we need to perform statistical Hypothesis Testing to establish if these two averages are statistically significantly different from one another.
t.test(`Travel time` ~ Group, data = pop_dstance_sample,
var.equal = FALSE)
# Welch Two Sample t-test
#
# data: Travel time by Group
# t = 1.1331, df = 58.767, p-value = 0.2618
# alternative hypothesis: true difference in means between group Control and group Treatment is not equal to 0
# 95 percent confidence interval:
# -1.110563 4.009977
# sample estimates:
# mean in group Control mean in group Treatment
# 24.46403 23.01432 Critical value of the t-statistics (see full tables at the end of slides):
Conclusion:
t.test(`Travel time` ~ Group, data = pop_dstance_sample,
var.equal = TRUE)
# Welch Two Sample t-test
#
# data: Travel time by Group
# t = 1.1331, df = 58.767, p-value = 0.2618
# alternative hypothesis: true difference in means between group Control and group Treatment is not equal to 0
# 95 percent confidence interval:
# -1.110563 4.009977
# sample estimates:
# mean in group Control mean in group Treatment
# 24.46403 23.01432 Test statistics, degrees of freedom, and confidence intervals change, but the conclusion remains the same.
The dependent variable here is a dummy variable (0|1), which takes the value of 1 if children are being enrolled in the school in a household and zero otherwise.
| Group | \(n\) | \(\hat\mu\) | \(s\) | \(\text{SE}\) |
|---|---|---|---|---|
| Control | 31 | 0.290 | 0.461 | 0.083 |
| Treatment | 33 | 0.606 | 0.496 | 0.086 |
t.test(school ~ Group,
data = pop_dstance_sample_enrollment,
var.equal = TRUE)
# Two Sample t-test
#
# data: school by Group
# t = -2.6316, df = 62, p-value = 0.01071
# alternative hypothesis: true difference in means between group Control and group Treatment is not equal to 0
# 95 percent confidence interval:
# -0.55557287 -0.07590318
# sample estimates:
# mean in group Control mean in group Treatment
# 0.2903226 0.6060606 t.test(school ~ Group,
data = pop_dstance_sample_enrollment,
var.equal = FALSE)
# Welch Two Sample t-test
#
# data: school by Group
# t = -2.6377, df = 61.995, p-value = 0.01054
# alternative hypothesis: true difference in means between group Control and group Treatment is not equal to 0
# 95 percent confidence interval:
# -0.55502140 -0.07645465
# sample estimates:
# mean in group Control mean in group Treatment
# 0.2903226 0.6060606 \(H_0: \text{School enrollment}_{\text{T}} = \text{School enrollment}_{\text{c}}\)
\(H_1: \text{School enrollment}_{\text{T}} \ne \text{School enrollment}_{\text{c}}\)
Conclusion:
Most commonly used statistical test for hypothesis testing about the estimated parameter (e.g., \(\widehat{\text{mean}}\), but also other estimates).
Its purpose is to infer:
whether or not the population parameter \(\mu\) (mean, or else)
is different from an arbitrary number (usually zero: \(\mu_{0} = 0\))
based on our sample estimates of
In principal, there are:
one-sample t-test: compares one mean to a number
two-sample t-test: compares means of two independent samples
Step 1. Hypothesis formulation;
Step 2. Calculating test statistic;
Step 3. Setting a decision rule for rejecting \(H_0\);
Step 4. Making a conclusion;
The population mean equals to zero \(\mu_{0}\)
The population mean is not zero \(\mu_{0}\)
\(H_1: \mu \ne \mu_{0}\)
\(H_1: \mu < \mu_{0}\)
\(H_1: \mu > \mu_{0}\)
\[t = \frac{\hat\mu - \mu_0}{\text{se}} = \frac{\sqrt{n} ( \hat\mu - \mu_0)}{s}\,,\]
where:
\(t\) - t-statistics;
\(\hat\mu\) - estimated mean and \(\mu_0\) is an arbitrary number;
\(se = s / \sqrt{n}\) - standard error of the estimated mean;
\(s\) - sample standard deviation;
\(n\) - number of observation;
Sample size: \(n = 25\)
Estimates mean: \(\hat \mu = -2.2\)
Sample SD: \(s = 3.3\)
Compute the t-statistics for the mean difference from zero.
\(\mu_0 = 0\)?
\(t = \frac{\sqrt{25} ( -2.2 - 0)}{3.3} \\ = 5 \cdot (-1/3) \\= -1.667\)
Compute the t-statistics for the mean difference from -5.5.
\(\mu_0 = -5.5\)?
\(t = \frac{\sqrt{25} ( -2.2 + 5.5)}{3.3} \\ = 5 \cdot 1 \\ = 5\)
To reject \(H_0\)
we compare t-statistics to a critical value \(c_{df, \text{CL}}\), with
\(\text{CL}\) - the confidence level
\(df\) - degrees of freedom
is the minimum values of the t-statistics when we can reject \(H_0\)
at the given confidence level, and
with the given degrees of freedom.
Confidence level depends on the significance level (\(\alpha\)) and the alternative hypothesis:
when \(H_1: \mu \ne \mu_{0}\) we use a two-sided t-test, thus
when \(H_1: \mu < \mu_{0}\) or \(H_1: \mu > \mu_{0}\) we use a one-sided t-test,
level of significance \(\alpha\);
- $\alpha = 0.05$
the number of degrees of freedom \(df = n - k\):
\(n\) is the number of observation in the sample and
\(k\) is the number of parameters
We can reject \(H_0: \mu = \mu_0\) in favor of \(H_1: \mu \neq \mu_{0}\) only if:
\(|t| > c_{df, 1 - \alpha / 2}\) for two-sided t-test \(H_1: \mu \ne \mu_{0}\)
\(|t| > c_{df, 1 - \alpha}\) for one-sided t-test \(H_1: \mu > \mu_{0}\) or \(H_1: \mu > \mu_{0}\)
In all other cases, we need to accept \(H_0\).
To find the critical value we use the quantiles of the t-distribution.
\(df = n - k\);
\(\text{CL} = 1 - \alpha / 2\) for \(H_1: \mu \ne \mu_{0}\)
\(\text{CL} = 1 - \alpha\) for \(H_1: \mu > \mu_{0}\) or \(H_1: \mu > \mu_{0}\)
| df | 0.9 | 0.95 | 0.975 | 0.99 | 0.995 |
|---|---|---|---|---|---|
| 1 | 3.0777 | 6.3138 | 12.7062 | 31.8205 | 63.6567 |
| 5 | 1.4759 | 2.0150 | 2.5706 | 3.3649 | 4.0321 |
| 10 | 1.3722 | 1.8125 | 2.2281 | 2.7638 | 3.1693 |
| 25 | 1.3163 | 1.7081 | 2.0595 | 2.4851 | 2.7874 |
| 40 | 1.3031 | 1.6839 | 2.0211 | 2.4233 | 2.7045 |
| 50 | 1.2987 | 1.6759 | 2.0086 | 2.4033 | 2.6778 |
| 75 | 1.2929 | 1.6654 | 1.9921 | 2.3771 | 2.6430 |
| 100 | 1.2901 | 1.6602 | 1.9840 | 2.3642 | 2.6259 |
| 150 | 1.2872 | 1.6551 | 1.9759 | 2.3515 | 2.6090 |
| 300 | 1.2844 | 1.6499 | 1.9679 | 2.3388 | 2.5923 |
| 1000 | 1.2824 | 1.6464 | 1.9623 | 2.3301 | 2.5808 |
| 10000 | 1.2816 | 1.6450 | 1.9602 | 2.3267 | 2.5763 |
| 1000000 | 1.2816 | 1.6449 | 1.9600 | 2.3264 | 2.5758 |
Sample size: \(n = 25\); \(df = 25 - 1 = 24\)
Is the population mean different from zero at a 1% level of significance?
\(H_1: \mu \ne 0\) - two-sided t-test (\(\alpha / 2\))
\(1 - \alpha / 2 = 1 - 0.01 / 2 = 0.995\)
\(c_{24, \, 1 - 0.01/ 2} = 2.7969\)
| df | 0.95 | 0.975 | 0.99 | 0.995 |
|---|---|---|---|---|
| 1 | 6.3138 | 12.7062 | 31.8205 | 63.6567 |
| 5 | 2.0150 | 2.5706 | 3.3649 | 4.0321 |
| 10 | 1.8125 | 2.2281 | 2.7638 | 3.1693 |
| 20 | 1.7247 | 2.0860 | 2.5280 | 2.8453 |
| 23 | 1.7139 | 2.0687 | 2.4999 | 2.8073 |
| 24 | 1.7109 | 2.0639 | 2.4922 | 2.7969 |
| 25 | 1.7081 | 2.0595 | 2.4851 | 2.7874 |
| 26 | 1.7056 | 2.0555 | 2.4786 | 2.7787 |
| 27 | 1.7033 | 2.0518 | 2.4727 | 2.7707 |
| 28 | 1.7011 | 2.0484 | 2.4671 | 2.7633 |
| 29 | 1.6991 | 2.0452 | 2.4620 | 2.7564 |
| 30 | 1.6973 | 2.0423 | 2.4573 | 2.7500 |
| 50 | 1.6759 | 2.0086 | 2.4033 | 2.6778 |
| 150 | 1.6551 | 1.9759 | 2.3515 | 2.6090 |
Sample size: \(n = 25\); \(df = 25 - 1 = 24\)
Is the population mean different from zero at a 5% level of significance?
\(H_1: \mu \ne 0\) - two-sided t-test (\(\alpha / 2\))
\(1 - \alpha / 2 = 1 - 0.05 / 2 = 0.975\)
\(c_{24, \, 1 - 0.05/ 2} = 2.0639\)
| df | 0.95 | 0.975 | 0.99 | 0.995 |
|---|---|---|---|---|
| 1 | 6.3138 | 12.7062 | 31.8205 | 63.6567 |
| 5 | 2.0150 | 2.5706 | 3.3649 | 4.0321 |
| 10 | 1.8125 | 2.2281 | 2.7638 | 3.1693 |
| 20 | 1.7247 | 2.0860 | 2.5280 | 2.8453 |
| 23 | 1.7139 | 2.0687 | 2.4999 | 2.8073 |
| 24 | 1.7109 | 2.0639 | 2.4922 | 2.7969 |
| 25 | 1.7081 | 2.0595 | 2.4851 | 2.7874 |
| 26 | 1.7056 | 2.0555 | 2.4786 | 2.7787 |
| 27 | 1.7033 | 2.0518 | 2.4727 | 2.7707 |
| 28 | 1.7011 | 2.0484 | 2.4671 | 2.7633 |
| 29 | 1.6991 | 2.0452 | 2.4620 | 2.7564 |
| 30 | 1.6973 | 2.0423 | 2.4573 | 2.7500 |
| 50 | 1.6759 | 2.0086 | 2.4033 | 2.6778 |
| 150 | 1.6551 | 1.9759 | 2.3515 | 2.6090 |
Sample size: \(n = 25\); \(df = 25 - 1 = 24\).
Is the population mean different from zero at 10% level of significance?
\(H_1: \mu \ne 0\) - two-sided t-test (\(\alpha / 2\))
\(1 - \alpha / 2 = 1 - 0.1 / 2 = 0.95\)
\(c_{24, \, 1 - 0.1/ 2} = 1.7109\)
| df | 0.95 | 0.975 | 0.99 | 0.995 |
|---|---|---|---|---|
| 1 | 6.3138 | 12.7062 | 31.8205 | 63.6567 |
| 5 | 2.0150 | 2.5706 | 3.3649 | 4.0321 |
| 10 | 1.8125 | 2.2281 | 2.7638 | 3.1693 |
| 20 | 1.7247 | 2.0860 | 2.5280 | 2.8453 |
| 23 | 1.7139 | 2.0687 | 2.4999 | 2.8073 |
| 24 | 1.7109 | 2.0639 | 2.4922 | 2.7969 |
| 25 | 1.7081 | 2.0595 | 2.4851 | 2.7874 |
| 26 | 1.7056 | 2.0555 | 2.4786 | 2.7787 |
| 27 | 1.7033 | 2.0518 | 2.4727 | 2.7707 |
| 28 | 1.7011 | 2.0484 | 2.4671 | 2.7633 |
| 29 | 1.6991 | 2.0452 | 2.4620 | 2.7564 |
| 30 | 1.6973 | 2.0423 | 2.4573 | 2.7500 |
| 50 | 1.6759 | 2.0086 | 2.4033 | 2.6778 |
| 150 | 1.6551 | 1.9759 | 2.3515 | 2.6090 |
Concluding either or:
We reject \(H_0\)
at least at the \(\alpha\) level of significance.
the population mean is significantly different from \(\mu_0\).
We fail to reject (we accept) \(H_0\).
available data do not provide sufficient evidence to reject \(H_0\) at the \(\alpha\) level of significance.
the population mean is statistically indifferent from \(\mu_0\).
Sample size: \(n = 25\). Estimates mean: \(\hat \mu = -2.2\). Sample SD: \(s = 3.3\)
Is the population mean different from zero (\(\mu_0 = 0\)) at 5% level of significance?
\(t = \frac{\sqrt{25} ( -2.2 - 0)}{3.3} = -1.667\)
\(c_{24, \, 1 - 0.05/ 2} = 2.0639\)
\(|t| < c_{24, \, 1 - 0.01/ 2}\)
\(|-1.667| < 2.0639\)
Conclusion:
Fail to reject (we accept) \(H_0\).
the population mean is statistically indifferent from \(\mu_0 = 0\).
Is the population mean different from -5.5 at the 1% level of significance?
\(\mu_0 = -5.5\)?
\(t = \frac{\sqrt{25} ( -2.2 + 5.5)}{3.3} = 5\)
\(c_{24, \, 1 - 0.05/ 2} = 2.7969\)
\(|t| > c_{24, \, 1 - 0.01/ 2}\)
\(|5| > 2.7969\)
Conclusion:
Reject \(H_0\).
the population mean is statistically different from \(\mu_0 = -5.5\) at least at the 1% level of significance.
Calculate the t-statistics and find corresponding critical values.
Conclude weather the H0 could be rejected in the following hypothesis testing problems.
Compare your calculations to the solutions.
| \(\hat \mu\) | s | \(\mu_0\) | n | \(\alpha\) | \(t\) | \(c_{df, \text{CL}}\) |
|---|---|---|---|---|---|---|
| 4.0 | 1.0 | 3.0 | 10 | 0.01 | 3.162 | 3.169 |
| 2.0 | 1.2 | 0.8 | 8 | 0.05 | 2.828 | 2.306 |
| 3.5 | 3.1 | 2.8 | 150 | 0.01 | 2.766 | 2.609 |
| 8.0 | 4.0 | 16.0 | 21 | 0.10 | -9.165 | 1.721 |
| 1.2 | 3.4 | 0.2 | 53 | 0.05 | 2.141 | 2.006 |
| df | 0.95 | 0.975 | 0.99 | 0.995 |
|---|---|---|---|---|
| 1 | 6.3138 | 12.7062 | 31.8205 | 63.6567 |
| 5 | 2.0150 | 2.5706 | 3.3649 | 4.0321 |
| 6 | 1.9432 | 2.4469 | 3.1427 | 3.7074 |
| 7 | 1.8946 | 2.3646 | 2.9980 | 3.4995 |
| 8 | 1.8595 | 2.3060 | 2.8965 | 3.3554 |
| 9 | 1.8331 | 2.2622 | 2.8214 | 3.2498 |
| 10 | 1.8125 | 2.2281 | 2.7638 | 3.1693 |
| 20 | 1.7247 | 2.0860 | 2.5280 | 2.8453 |
| 25 | 1.7081 | 2.0595 | 2.4851 | 2.7874 |
| 30 | 1.6973 | 2.0423 | 2.4573 | 2.7500 |
| 50 | 1.6759 | 2.0086 | 2.4033 | 2.6778 |
| 80 | 1.6641 | 1.9901 | 2.3739 | 2.6387 |
| 100 | 1.6602 | 1.9840 | 2.3642 | 2.6259 |
| 150 | 1.6551 | 1.9759 | 2.3515 | 2.6090 |
The slides below contain the t-scores (critical values of the t-distribution) for t-distributions with 1-150 degrees of freedom.
| df | 0.9 | 0.95 | 0.975 | 0.99 | 0.995 |
|---|---|---|---|---|---|
| 1 | 3.078 | 6.314 | 12.706 | 31.821 | 63.657 |
| 2 | 1.886 | 2.920 | 4.303 | 6.965 | 9.925 |
| 3 | 1.638 | 2.353 | 3.182 | 4.541 | 5.841 |
| 4 | 1.533 | 2.132 | 2.776 | 3.747 | 4.604 |
| 5 | 1.476 | 2.015 | 2.571 | 3.365 | 4.032 |
| 6 | 1.440 | 1.943 | 2.447 | 3.143 | 3.707 |
| 7 | 1.415 | 1.895 | 2.365 | 2.998 | 3.499 |
| 8 | 1.397 | 1.860 | 2.306 | 2.896 | 3.355 |
| 9 | 1.383 | 1.833 | 2.262 | 2.821 | 3.250 |
| 10 | 1.372 | 1.812 | 2.228 | 2.764 | 3.169 |
| 11 | 1.363 | 1.796 | 2.201 | 2.718 | 3.106 |
| 12 | 1.356 | 1.782 | 2.179 | 2.681 | 3.055 |
| 13 | 1.350 | 1.771 | 2.160 | 2.650 | 3.012 |
| 14 | 1.345 | 1.761 | 2.145 | 2.624 | 2.977 |
| 15 | 1.341 | 1.753 | 2.131 | 2.602 | 2.947 |
| df | 0.9 | 0.95 | 0.975 | 0.99 | 0.995 |
|---|---|---|---|---|---|
| 16 | 1.337 | 1.746 | 2.120 | 2.583 | 2.921 |
| 17 | 1.333 | 1.740 | 2.110 | 2.567 | 2.898 |
| 18 | 1.330 | 1.734 | 2.101 | 2.552 | 2.878 |
| 19 | 1.328 | 1.729 | 2.093 | 2.539 | 2.861 |
| 20 | 1.325 | 1.725 | 2.086 | 2.528 | 2.845 |
| 21 | 1.323 | 1.721 | 2.080 | 2.518 | 2.831 |
| 22 | 1.321 | 1.717 | 2.074 | 2.508 | 2.819 |
| 23 | 1.319 | 1.714 | 2.069 | 2.500 | 2.807 |
| 24 | 1.318 | 1.711 | 2.064 | 2.492 | 2.797 |
| 25 | 1.316 | 1.708 | 2.060 | 2.485 | 2.787 |
| 26 | 1.315 | 1.706 | 2.056 | 2.479 | 2.779 |
| 27 | 1.314 | 1.703 | 2.052 | 2.473 | 2.771 |
| 28 | 1.313 | 1.701 | 2.048 | 2.467 | 2.763 |
| 29 | 1.311 | 1.699 | 2.045 | 2.462 | 2.756 |
| 30 | 1.310 | 1.697 | 2.042 | 2.457 | 2.750 |
| df | 0.9 | 0.95 | 0.975 | 0.99 | 0.995 |
|---|---|---|---|---|---|
| 31 | 1.309 | 1.696 | 2.040 | 2.453 | 2.744 |
| 32 | 1.309 | 1.694 | 2.037 | 2.449 | 2.738 |
| 33 | 1.308 | 1.692 | 2.035 | 2.445 | 2.733 |
| 34 | 1.307 | 1.691 | 2.032 | 2.441 | 2.728 |
| 35 | 1.306 | 1.690 | 2.030 | 2.438 | 2.724 |
| 36 | 1.306 | 1.688 | 2.028 | 2.434 | 2.719 |
| 37 | 1.305 | 1.687 | 2.026 | 2.431 | 2.715 |
| 38 | 1.304 | 1.686 | 2.024 | 2.429 | 2.712 |
| 39 | 1.304 | 1.685 | 2.023 | 2.426 | 2.708 |
| 40 | 1.303 | 1.684 | 2.021 | 2.423 | 2.704 |
| 41 | 1.303 | 1.683 | 2.020 | 2.421 | 2.701 |
| 42 | 1.302 | 1.682 | 2.018 | 2.418 | 2.698 |
| 43 | 1.302 | 1.681 | 2.017 | 2.416 | 2.695 |
| 44 | 1.301 | 1.680 | 2.015 | 2.414 | 2.692 |
| 45 | 1.301 | 1.679 | 2.014 | 2.412 | 2.690 |
| df | 0.9 | 0.95 | 0.975 | 0.99 | 0.995 |
|---|---|---|---|---|---|
| 46 | 1.300 | 1.679 | 2.013 | 2.410 | 2.687 |
| 47 | 1.300 | 1.678 | 2.012 | 2.408 | 2.685 |
| 48 | 1.299 | 1.677 | 2.011 | 2.407 | 2.682 |
| 49 | 1.299 | 1.677 | 2.010 | 2.405 | 2.680 |
| 50 | 1.299 | 1.676 | 2.009 | 2.403 | 2.678 |
| 51 | 1.298 | 1.675 | 2.008 | 2.402 | 2.676 |
| 52 | 1.298 | 1.675 | 2.007 | 2.400 | 2.674 |
| 53 | 1.298 | 1.674 | 2.006 | 2.399 | 2.672 |
| 54 | 1.297 | 1.674 | 2.005 | 2.397 | 2.670 |
| 55 | 1.297 | 1.673 | 2.004 | 2.396 | 2.668 |
| 56 | 1.297 | 1.673 | 2.003 | 2.395 | 2.667 |
| 57 | 1.297 | 1.672 | 2.002 | 2.394 | 2.665 |
| 58 | 1.296 | 1.672 | 2.002 | 2.392 | 2.663 |
| 59 | 1.296 | 1.671 | 2.001 | 2.391 | 2.662 |
| 60 | 1.296 | 1.671 | 2.000 | 2.390 | 2.660 |
| df | 0.9 | 0.95 | 0.975 | 0.99 | 0.995 |
|---|---|---|---|---|---|
| 65 | 1.295 | 1.669 | 1.997 | 2.385 | 2.654 |
| 70 | 1.294 | 1.667 | 1.994 | 2.381 | 2.648 |
| 75 | 1.293 | 1.665 | 1.992 | 2.377 | 2.643 |
| 80 | 1.292 | 1.664 | 1.990 | 2.374 | 2.639 |
| 85 | 1.292 | 1.663 | 1.988 | 2.371 | 2.635 |
| 90 | 1.291 | 1.662 | 1.987 | 2.368 | 2.632 |
| 95 | 1.291 | 1.661 | 1.985 | 2.366 | 2.629 |
| 100 | 1.290 | 1.660 | 1.984 | 2.364 | 2.626 |
| 105 | 1.290 | 1.659 | 1.983 | 2.362 | 2.623 |
| 110 | 1.289 | 1.659 | 1.982 | 2.361 | 2.621 |
| 115 | 1.289 | 1.658 | 1.981 | 2.359 | 2.619 |
| 120 | 1.289 | 1.658 | 1.980 | 2.358 | 2.617 |
| 125 | 1.288 | 1.657 | 1.979 | 2.357 | 2.616 |
| 130 | 1.288 | 1.657 | 1.978 | 2.355 | 2.614 |
| 135 | 1.288 | 1.656 | 1.978 | 2.354 | 2.613 |
| df | 0.9 | 0.95 | 0.975 | 0.99 | 0.995 |
|---|---|---|---|---|---|
| 140 | 1.288 | 1.656 | 1.977 | 2.353 | 2.611 |
| 145 | 1.287 | 1.655 | 1.976 | 2.352 | 2.610 |
| 150 | 1.287 | 1.655 | 1.976 | 2.351 | 2.609 |
| 155 | 1.287 | 1.655 | 1.975 | 2.351 | 2.608 |
| 160 | 1.287 | 1.654 | 1.975 | 2.350 | 2.607 |
| 165 | 1.287 | 1.654 | 1.974 | 2.349 | 2.606 |
| 170 | 1.287 | 1.654 | 1.974 | 2.348 | 2.605 |
| 175 | 1.286 | 1.654 | 1.974 | 2.348 | 2.604 |
| 180 | 1.286 | 1.653 | 1.973 | 2.347 | 2.603 |
| 185 | 1.286 | 1.653 | 1.973 | 2.347 | 2.603 |
| 190 | 1.286 | 1.653 | 1.973 | 2.346 | 2.602 |
| 195 | 1.286 | 1.653 | 1.972 | 2.346 | 2.601 |
| 200 | 1.286 | 1.653 | 1.972 | 2.345 | 2.601 |
| 250 | 1.285 | 1.651 | 1.969 | 2.341 | 2.596 |
| 300 | 1.284 | 1.650 | 1.968 | 2.339 | 2.592 |
| df | 0.9 | 0.95 | 0.975 | 0.99 | 0.995 |
|---|---|---|---|---|---|
| 300 | 1.284 | 1.650 | 1.968 | 2.339 | 2.592 |
| 350 | 1.284 | 1.649 | 1.967 | 2.337 | 2.590 |
| 400 | 1.284 | 1.649 | 1.966 | 2.336 | 2.588 |
| 450 | 1.283 | 1.648 | 1.965 | 2.335 | 2.587 |
| 500 | 1.283 | 1.648 | 1.965 | 2.334 | 2.586 |
| 550 | 1.283 | 1.648 | 1.964 | 2.333 | 2.585 |
| 600 | 1.283 | 1.647 | 1.964 | 2.333 | 2.584 |
| 650 | 1.283 | 1.647 | 1.964 | 2.332 | 2.583 |
| 700 | 1.283 | 1.647 | 1.963 | 2.332 | 2.583 |
| 750 | 1.283 | 1.647 | 1.963 | 2.331 | 2.582 |
| 800 | 1.283 | 1.647 | 1.963 | 2.331 | 2.582 |
| 850 | 1.283 | 1.647 | 1.963 | 2.331 | 2.582 |
| 900 | 1.282 | 1.647 | 1.963 | 2.330 | 2.581 |
| 950 | 1.282 | 1.646 | 1.962 | 2.330 | 2.581 |
| 1000 | 1.282 | 1.646 | 1.962 | 2.330 | 2.581 |
| df | 0.9 | 0.95 | 0.975 | 0.99 | 0.995 |
|---|---|---|---|---|---|
| 2000 | 1.282 | 1.646 | 1.961 | 2.328 | 2.578 |
| 3000 | 1.282 | 1.645 | 1.961 | 2.328 | 2.577 |
| 4000 | 1.282 | 1.645 | 1.961 | 2.327 | 2.577 |
| 5000 | 1.282 | 1.645 | 1.960 | 2.327 | 2.577 |
| 6000 | 1.282 | 1.645 | 1.960 | 2.327 | 2.577 |
| 7000 | 1.282 | 1.645 | 1.960 | 2.327 | 2.577 |
| 8000 | 1.282 | 1.645 | 1.960 | 2.327 | 2.576 |
| 9000 | 1.282 | 1.645 | 1.960 | 2.327 | 2.576 |
| 10000 | 1.282 | 1.645 | 1.960 | 2.327 | 2.576 |
This homework generally outlines examples of the exam questions.
Use paper (Duflo et al. 2008) (available on Ilias);
Perform a statistical hypothesis testing of the mean yield increase for panel A-C in table 1.
State H0 and H1;
Conclude about the effect of fertilizer application on the yields for each of the panels.
Watch “Randomized Trials: The Ideal Weapon” (It was suggested already in one of the previous lectures)
T-distribution:
Confidence intervals:
t-test:

MK-068-EN (TM) WS2024/25. (c) Eduard Bukin