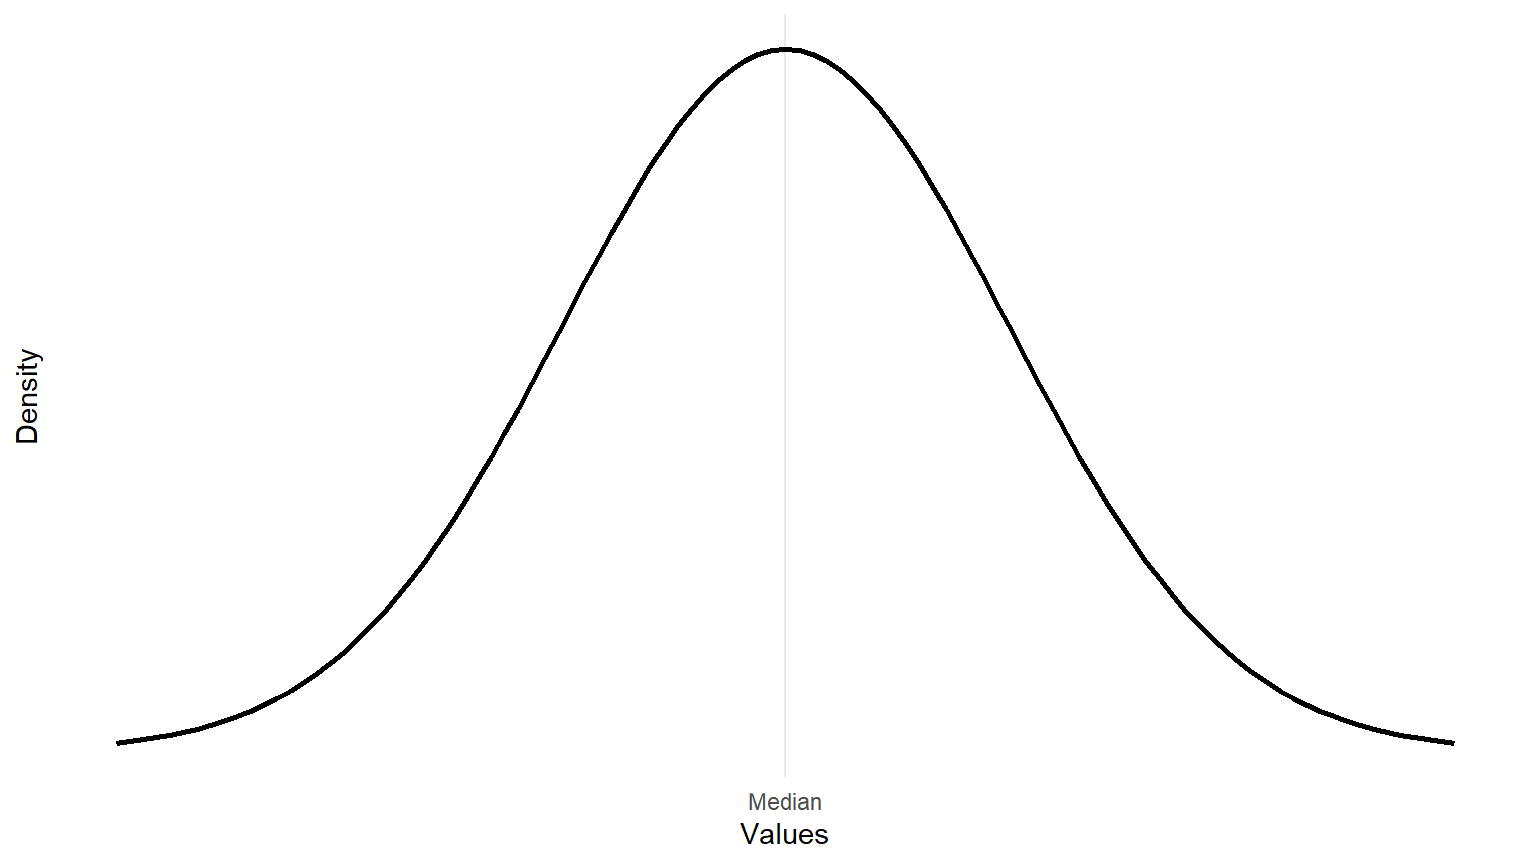
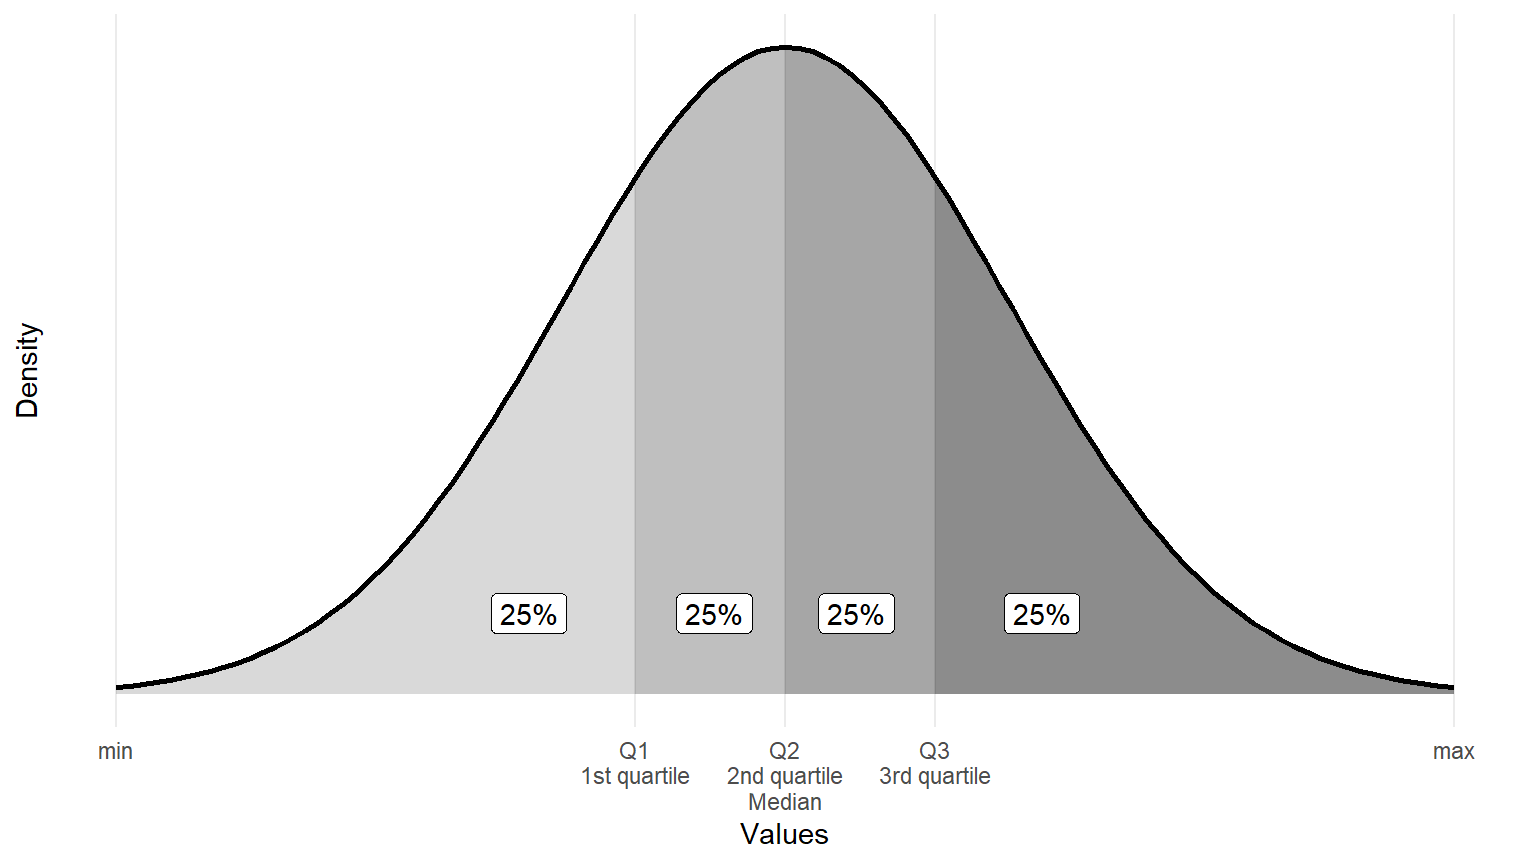
Quartiles: every 25% of observations
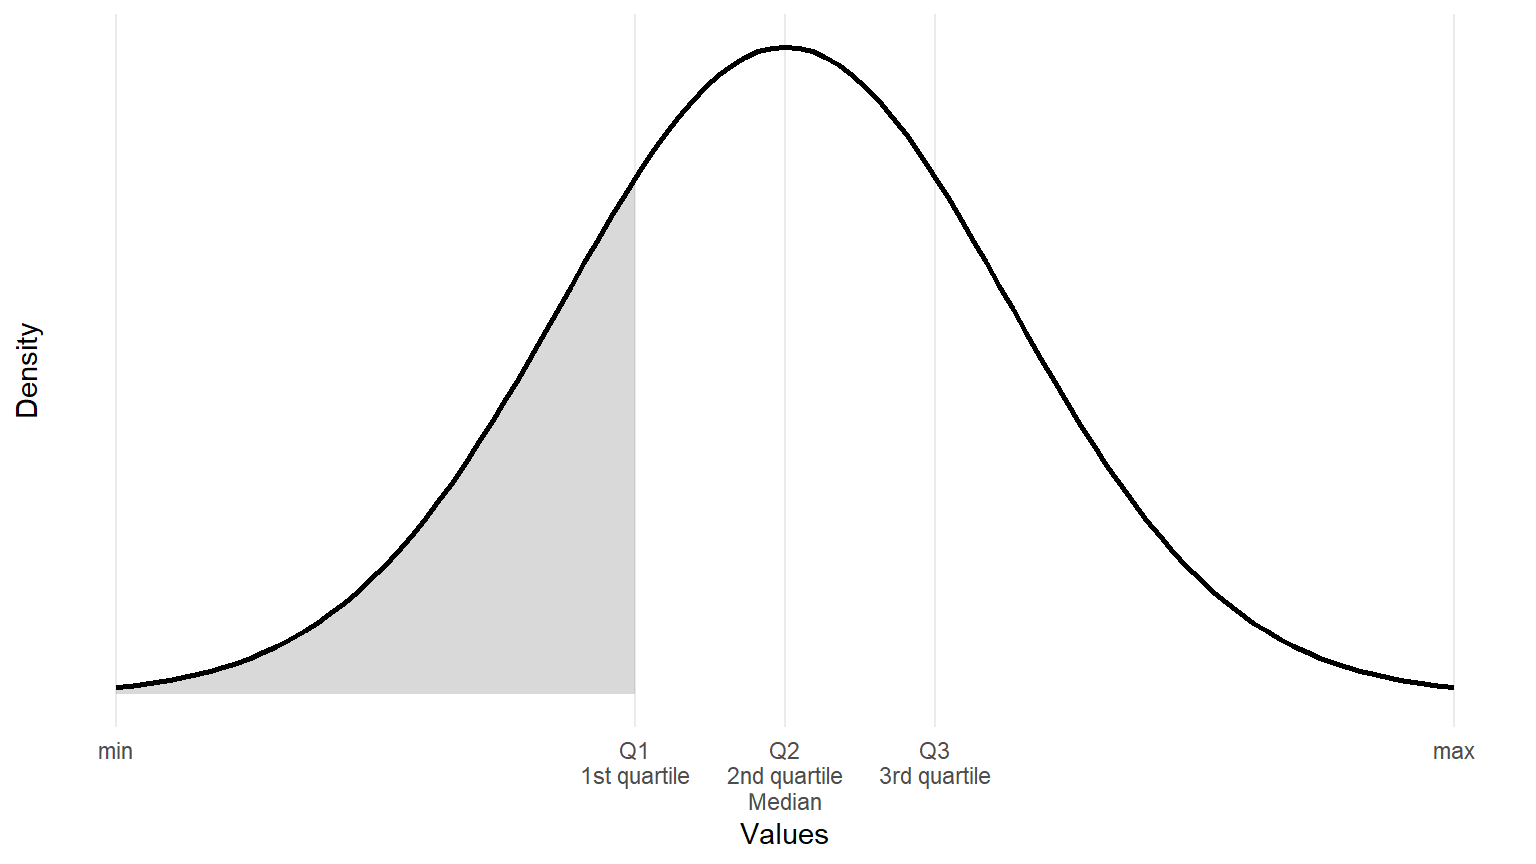
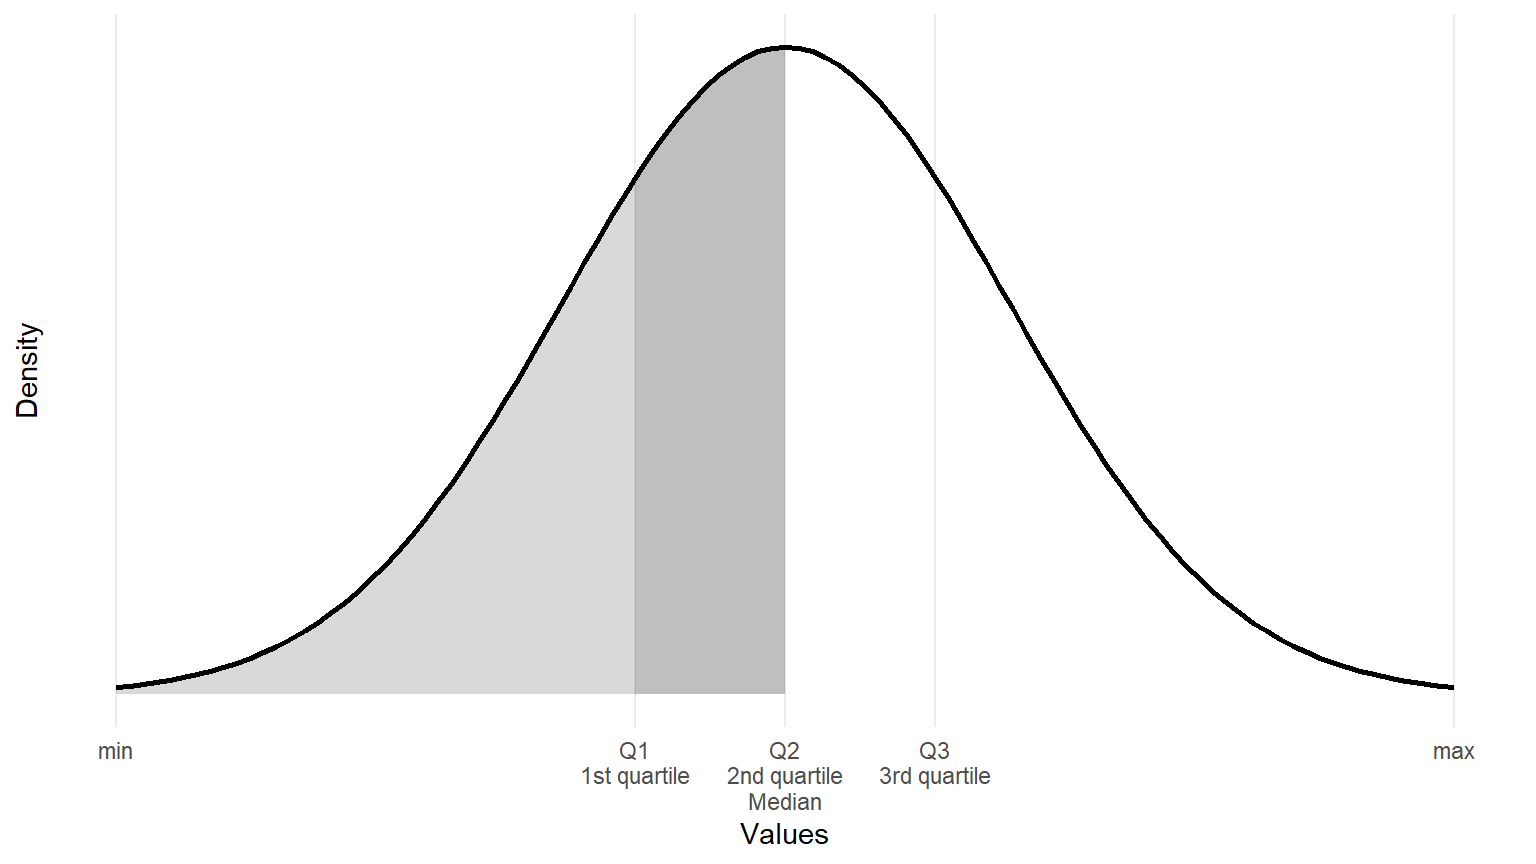
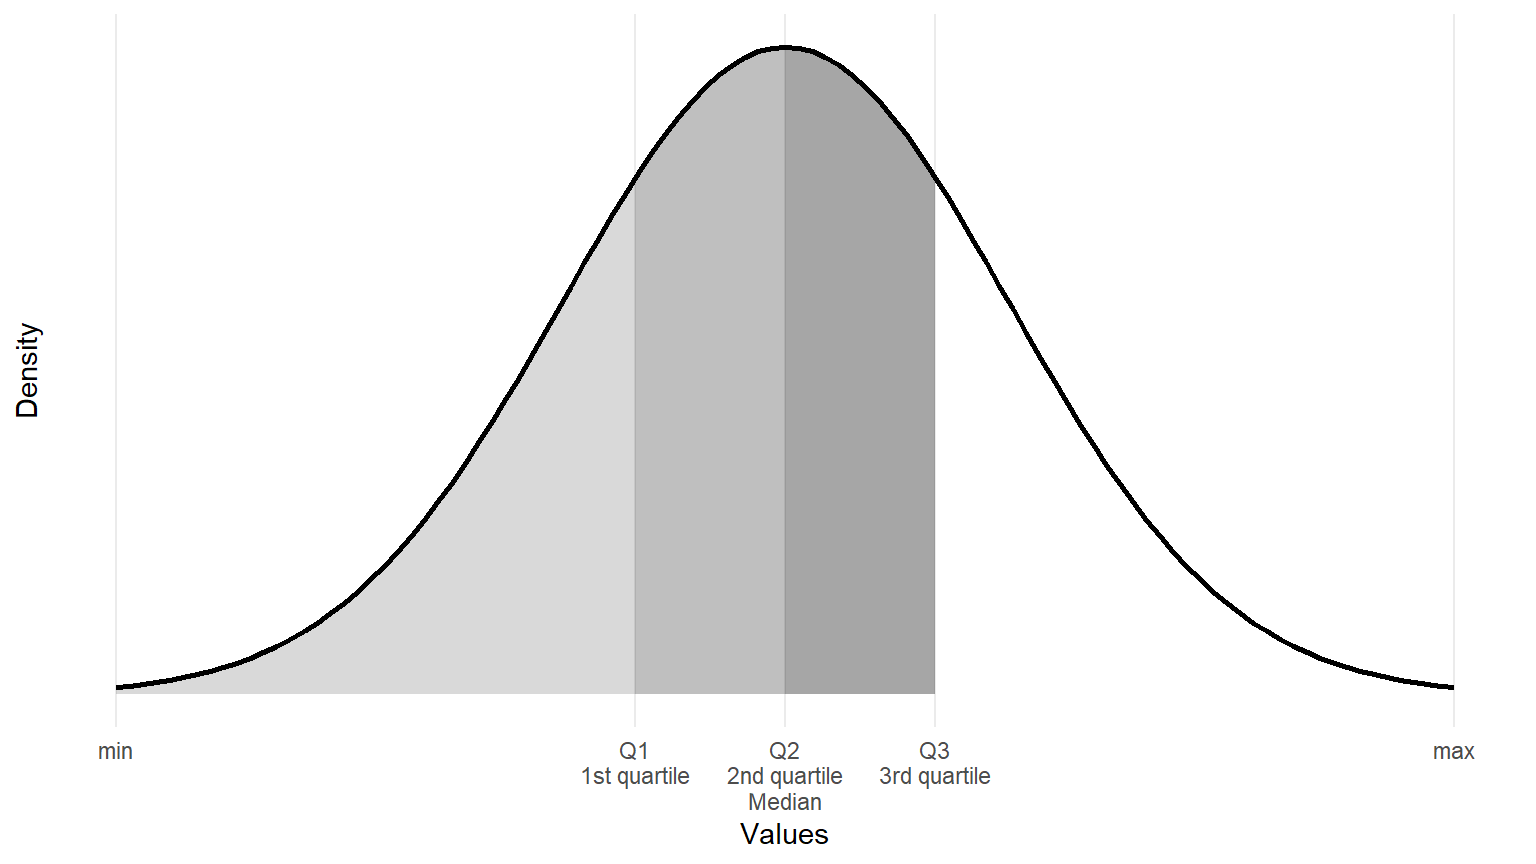
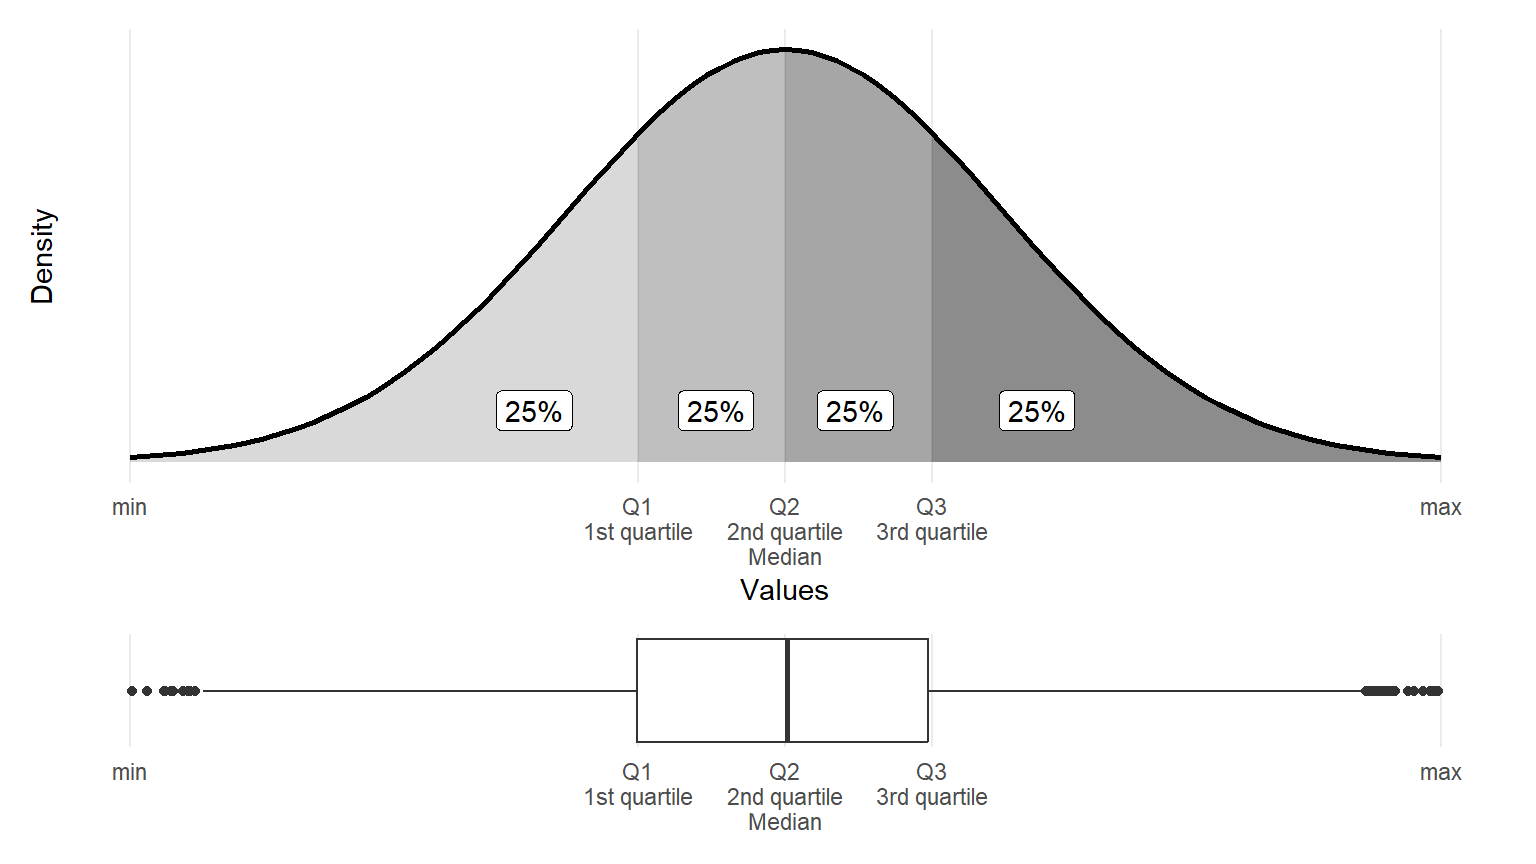
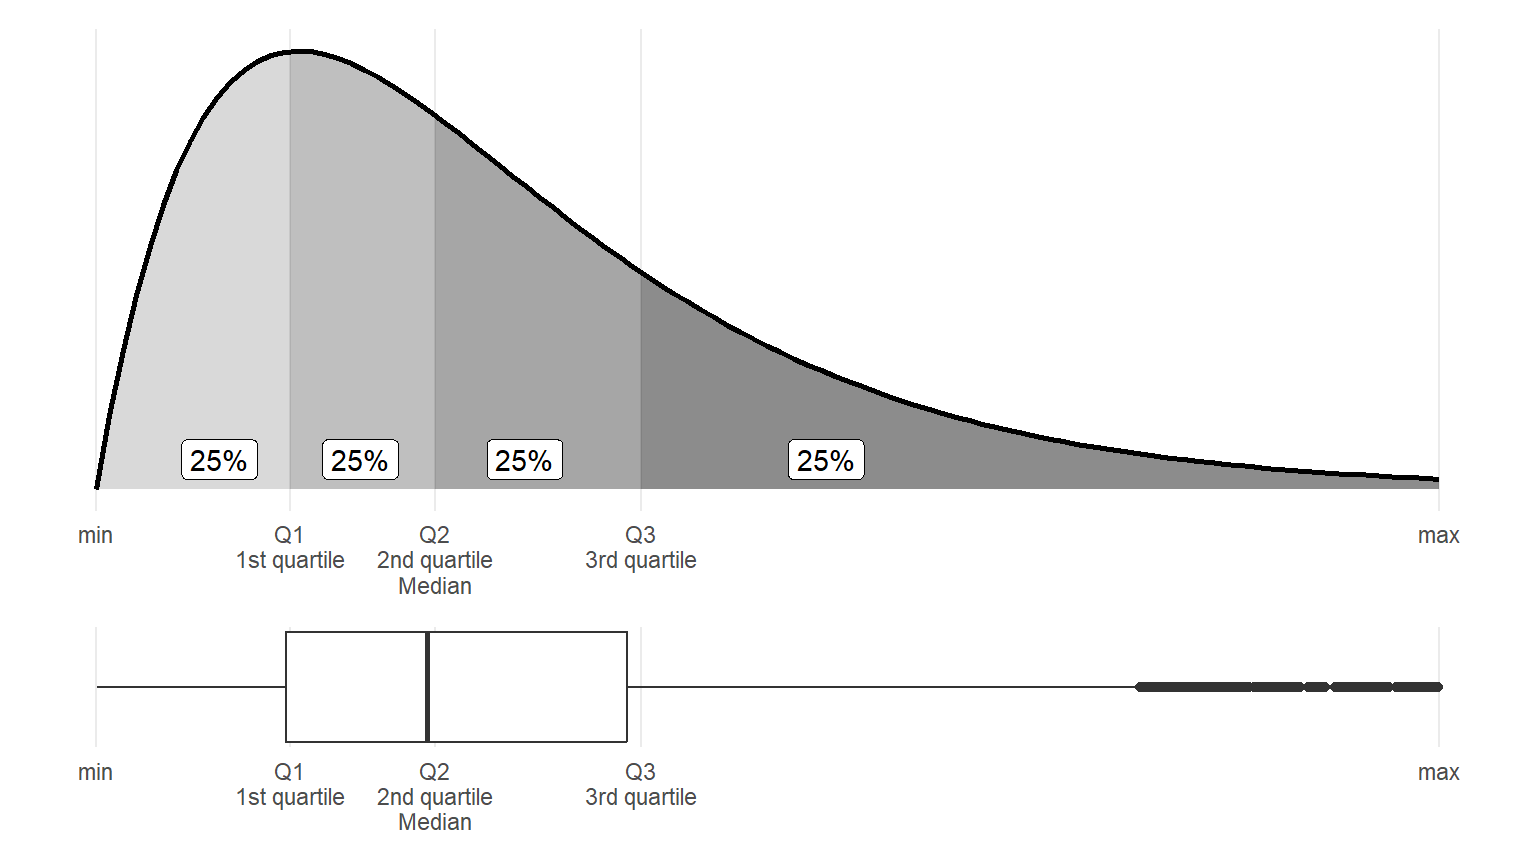
Quartiles: non-normal distribution
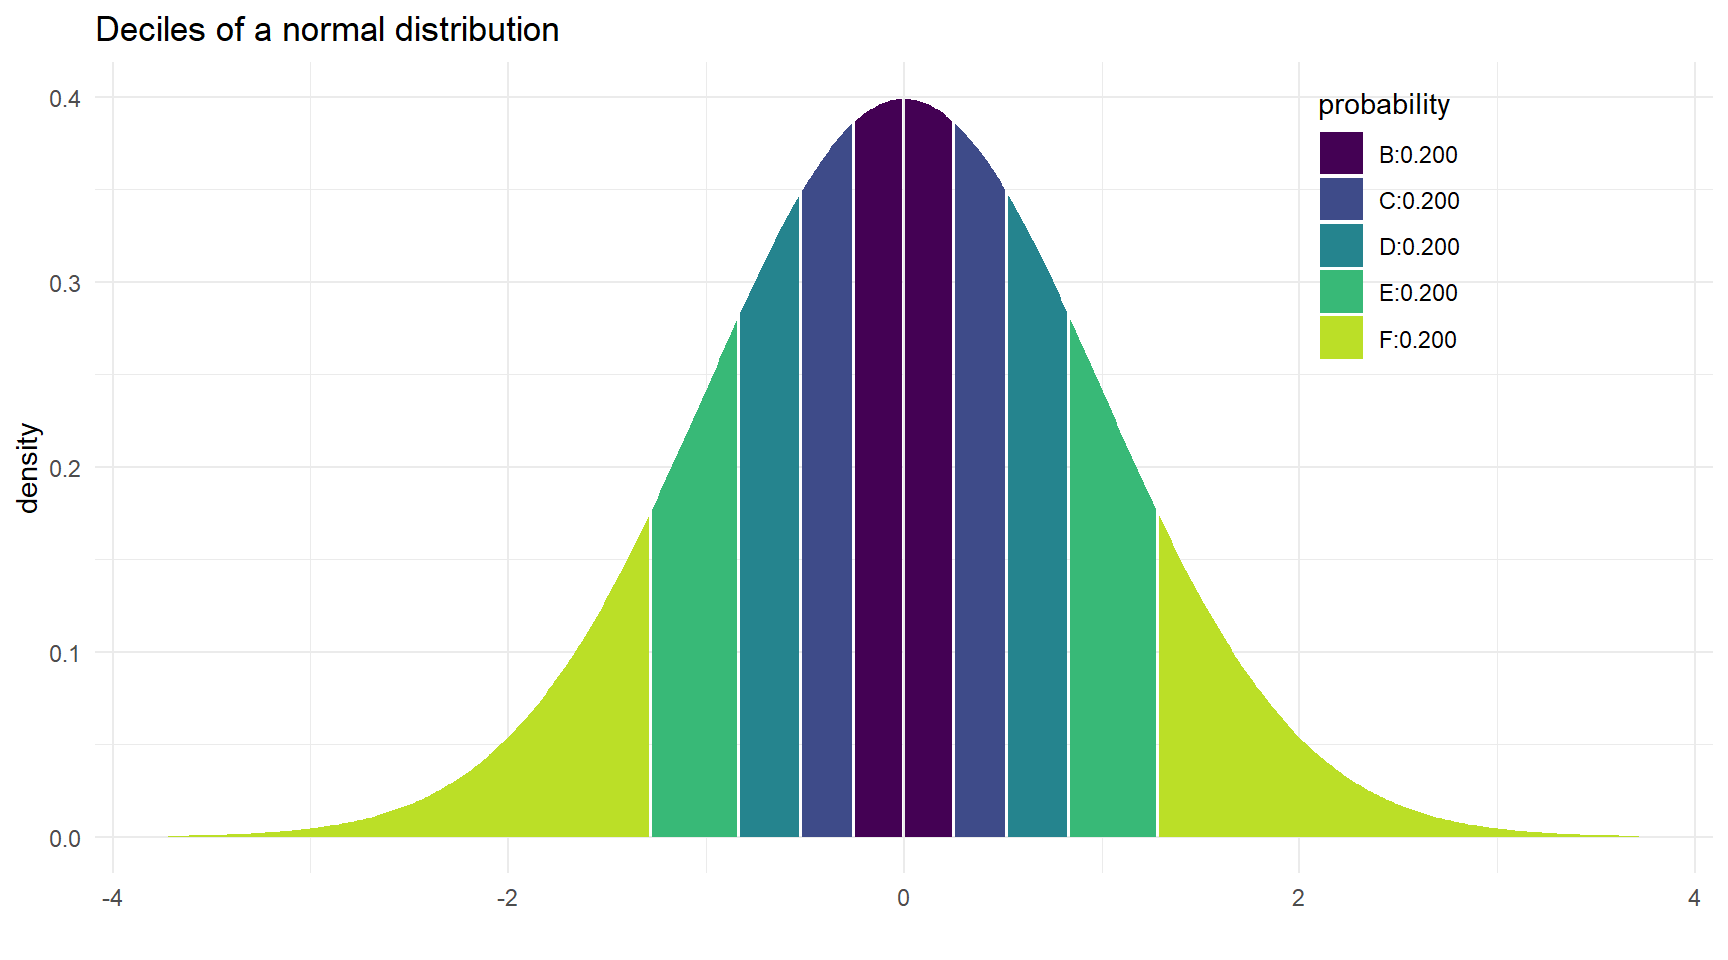
Deciles: every 10% of observations (Normal)
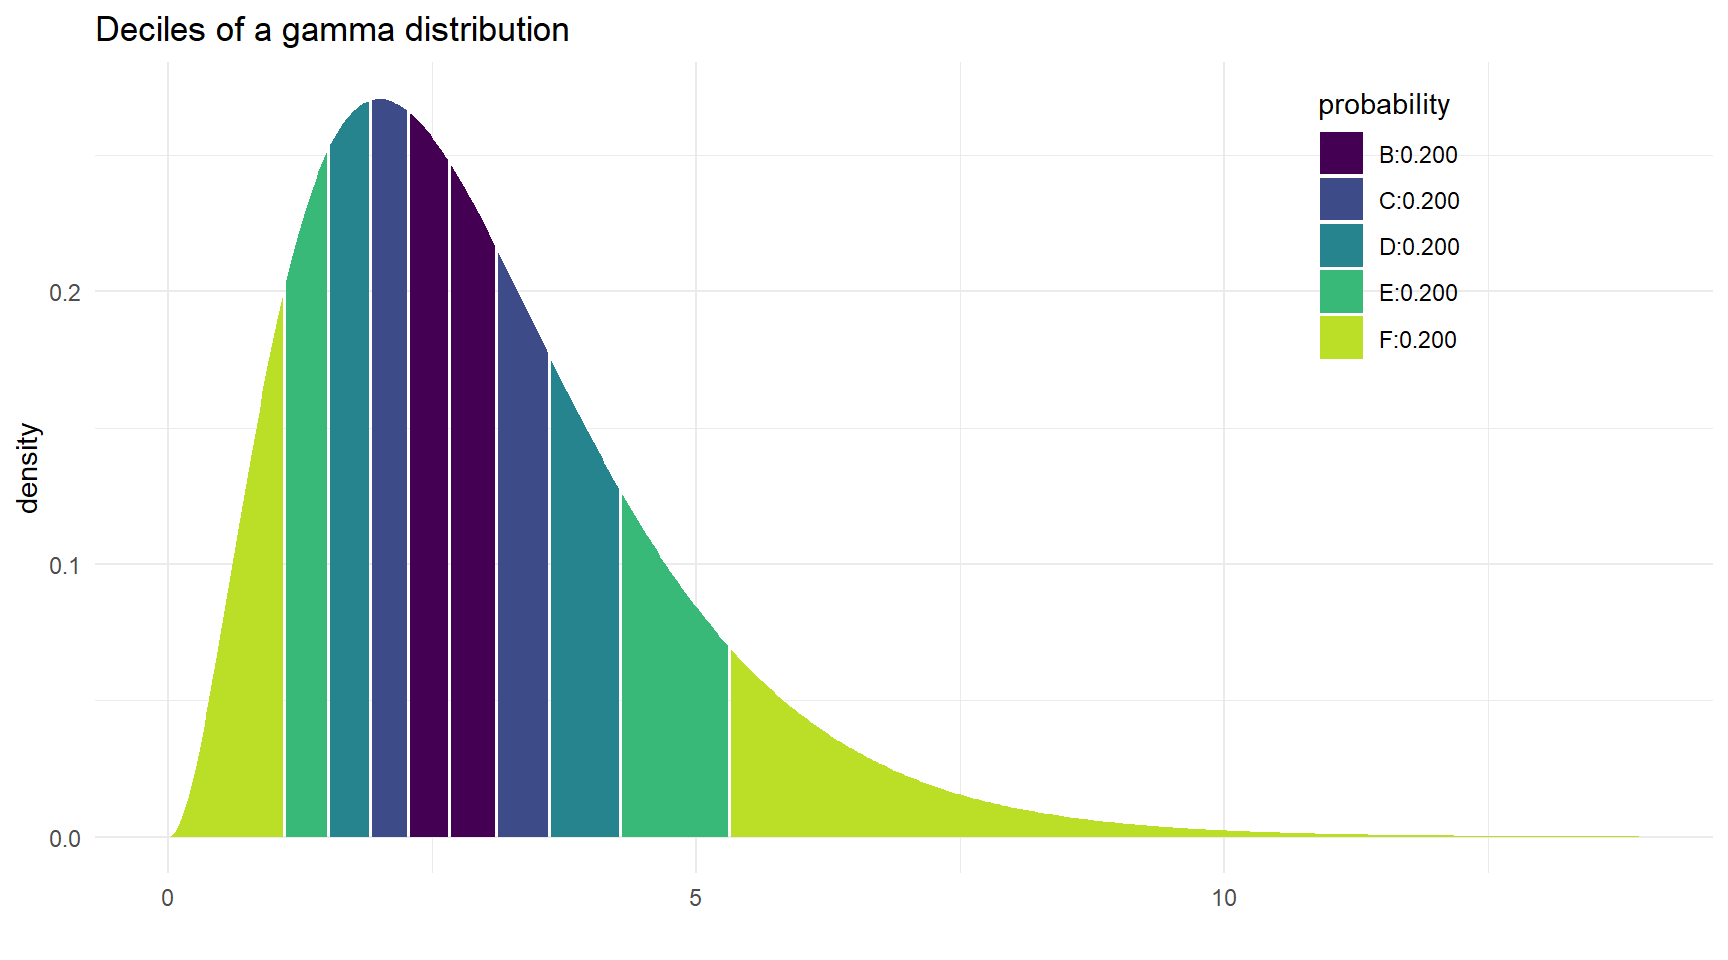
Deciles: Gamma distribution
Deciles (1) of Income Distribution
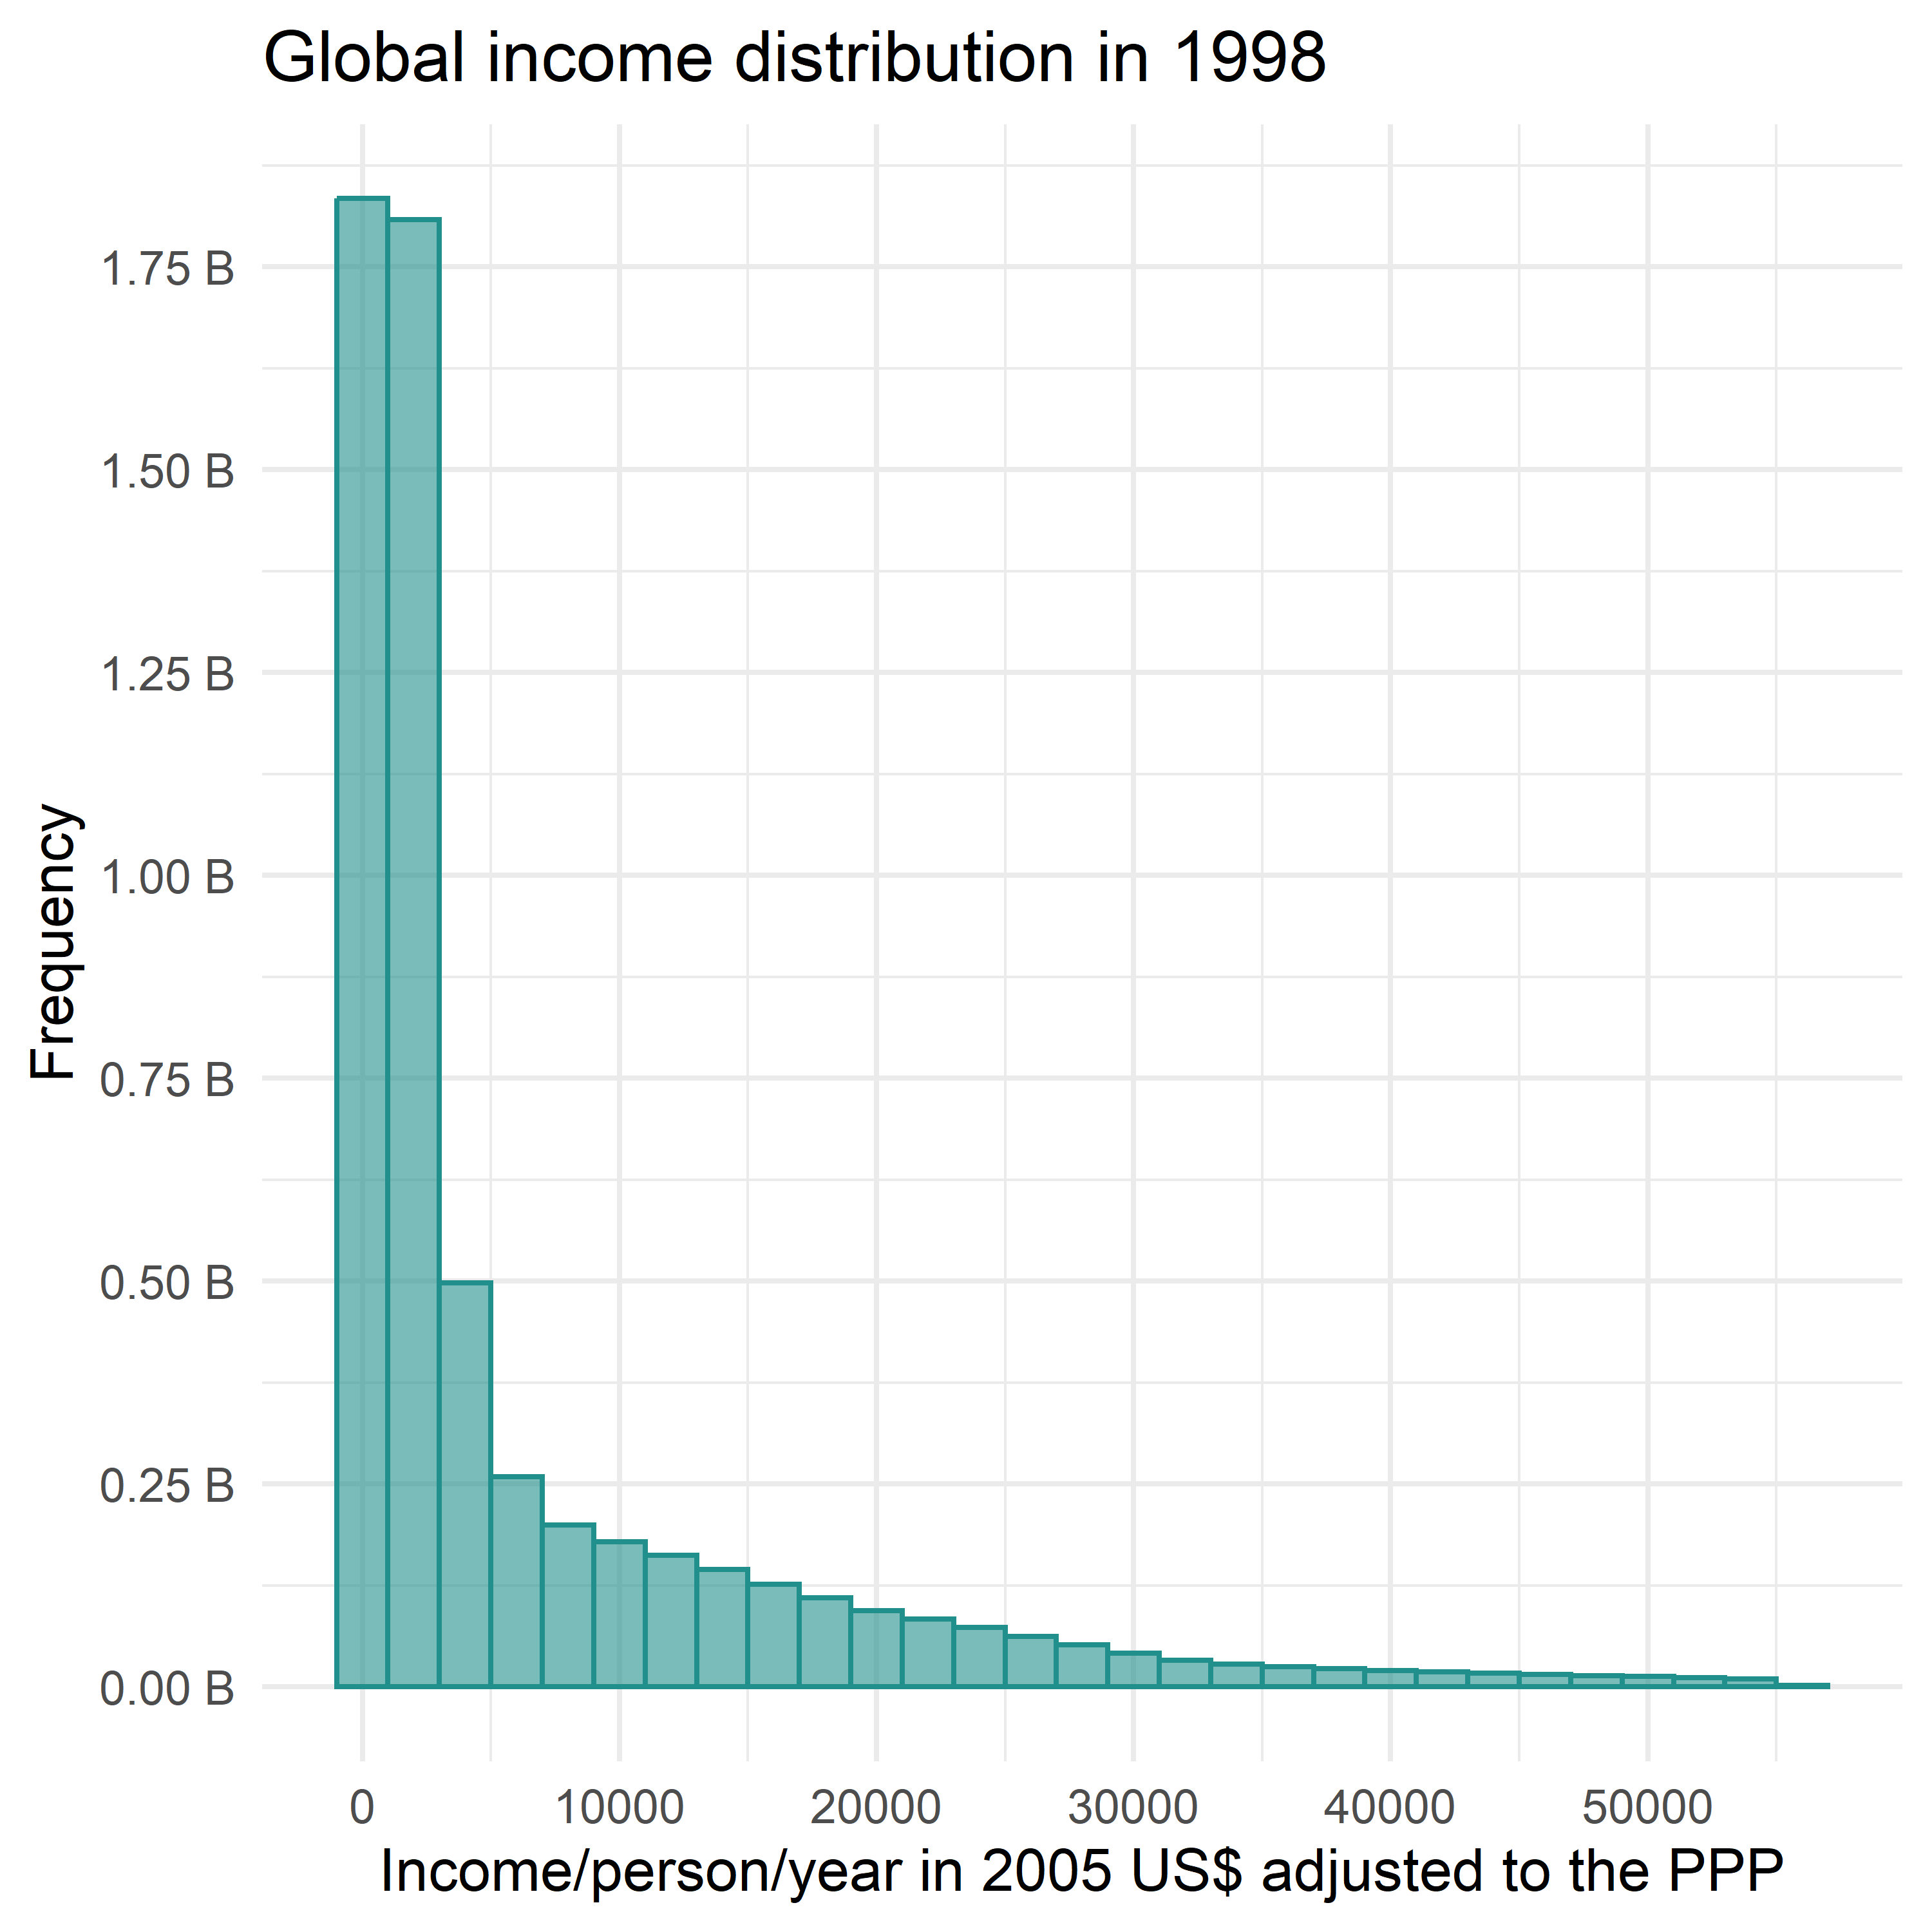
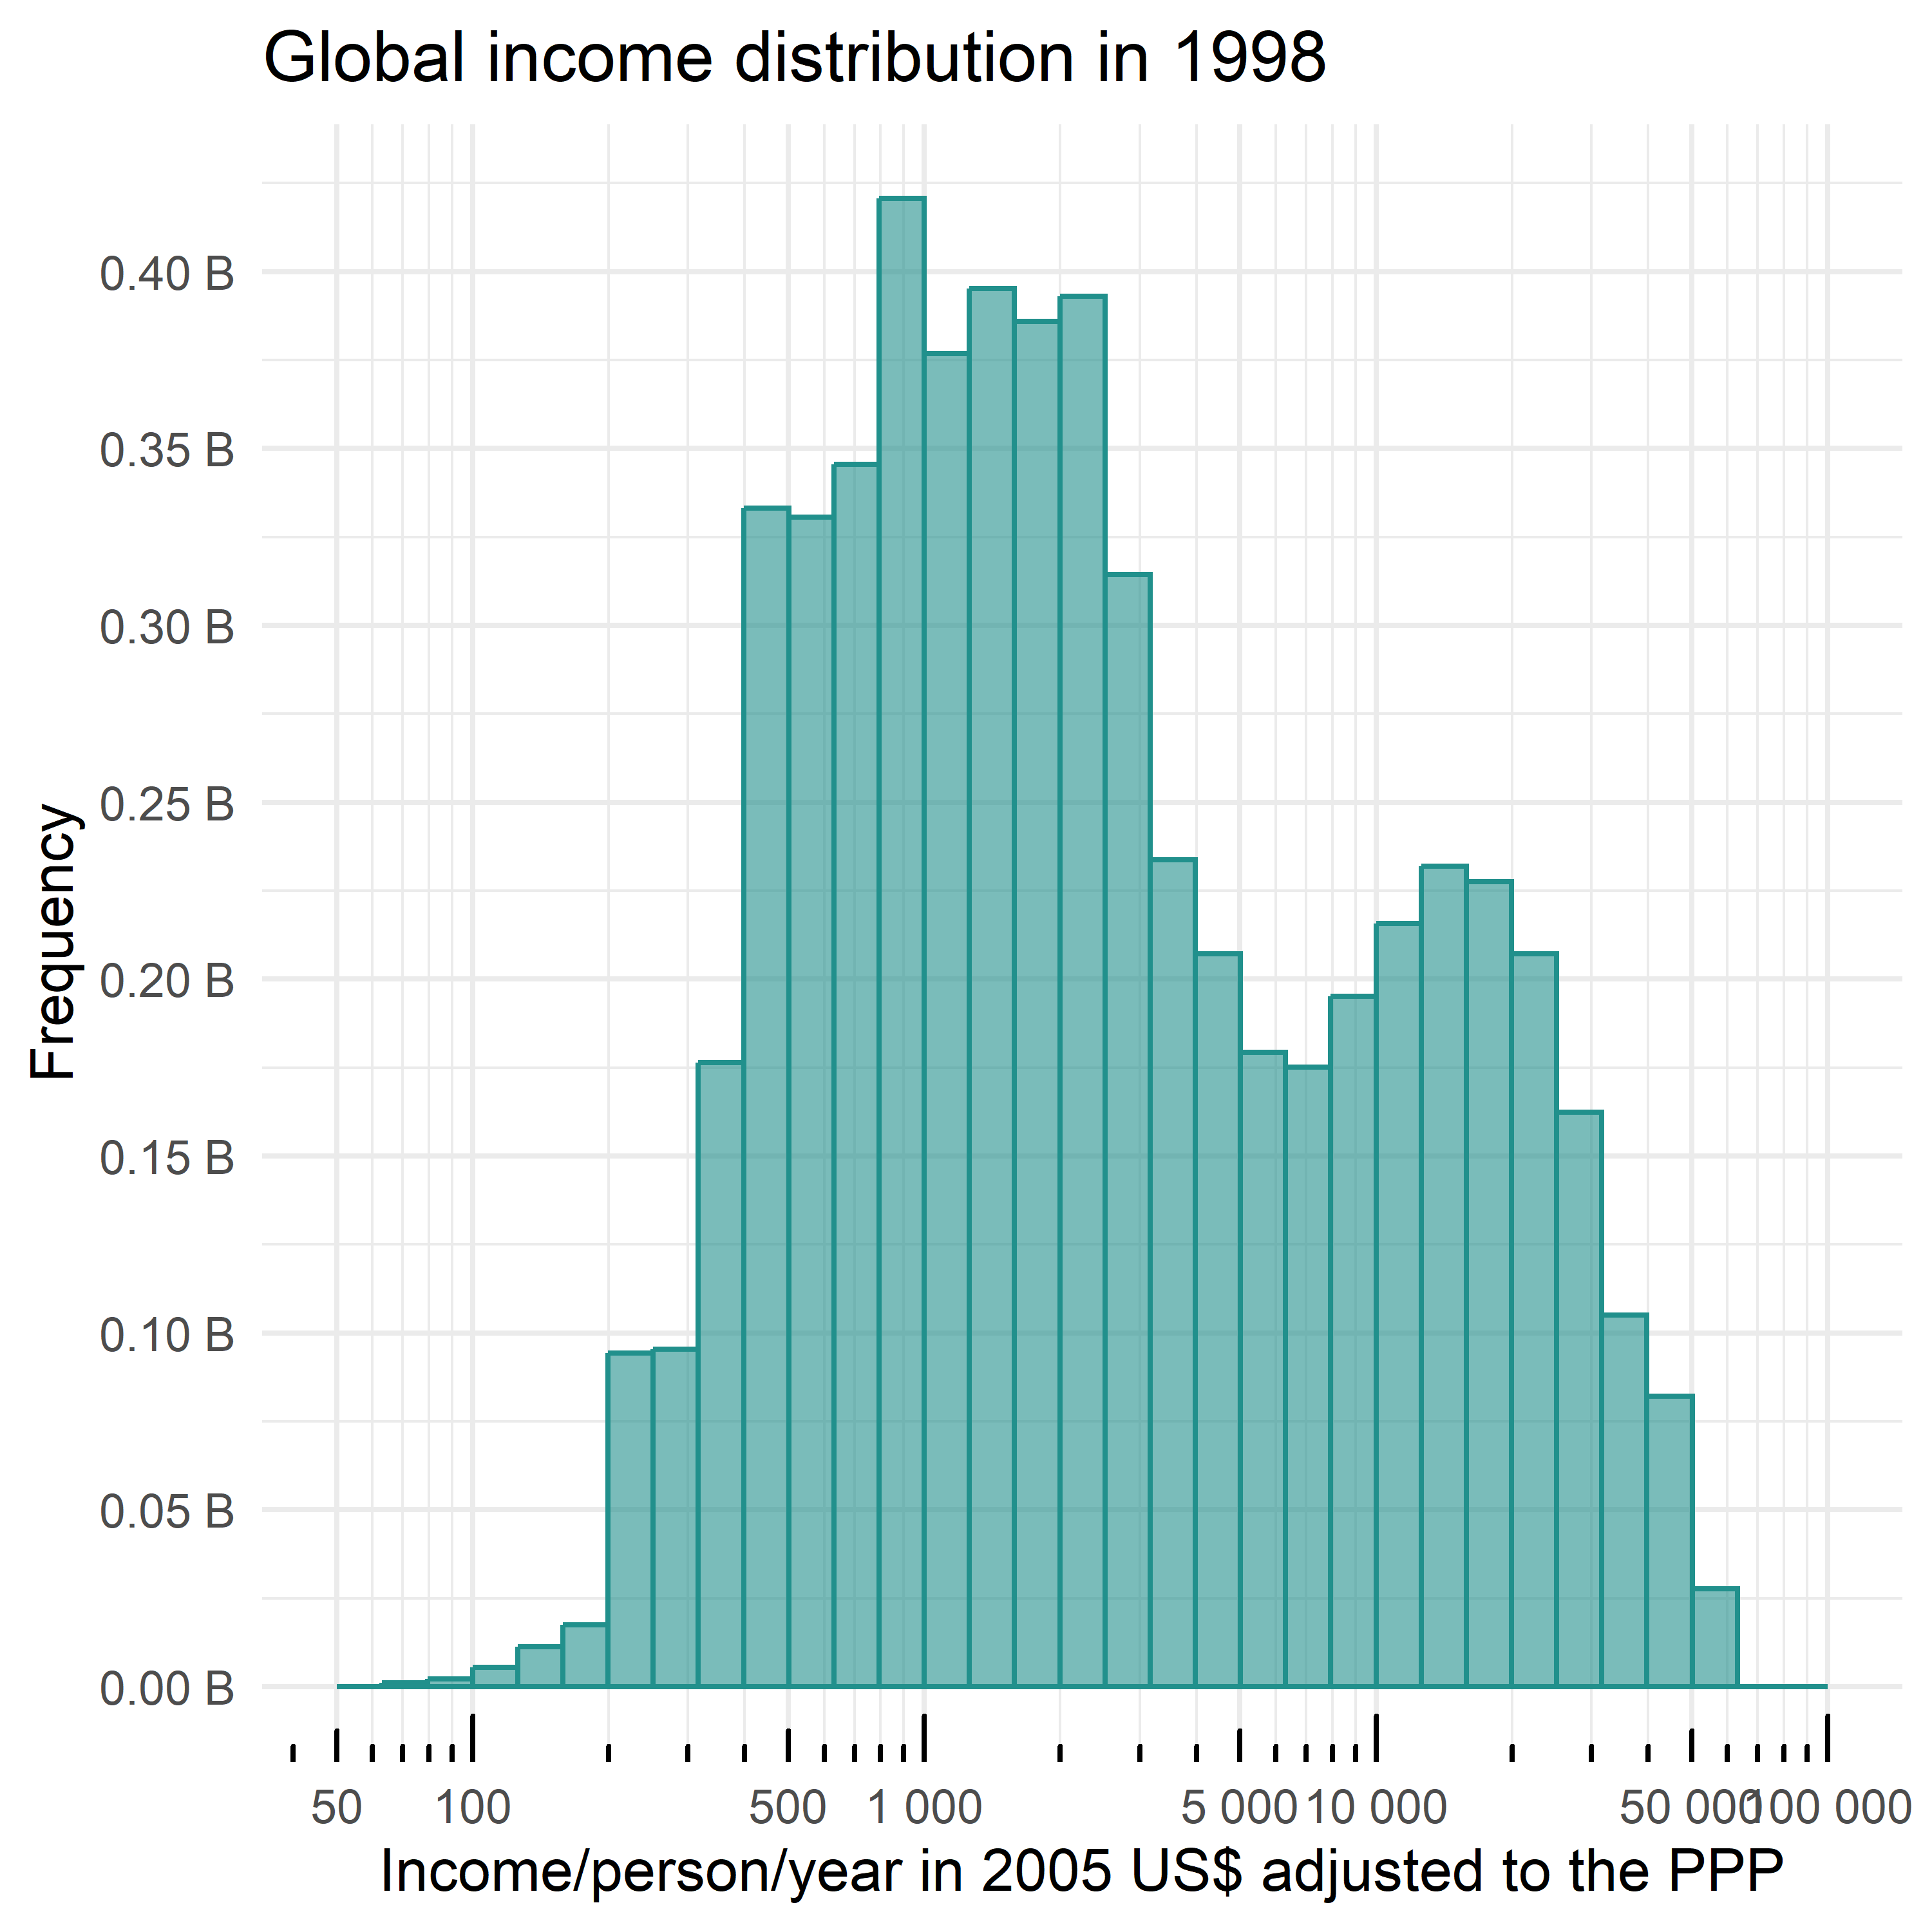
Deciles (2) of Income Distribution
Let us draw a histogram with frequency by deciles!
- Note: the total population in 1998 was 6 billion
- Is it useful?
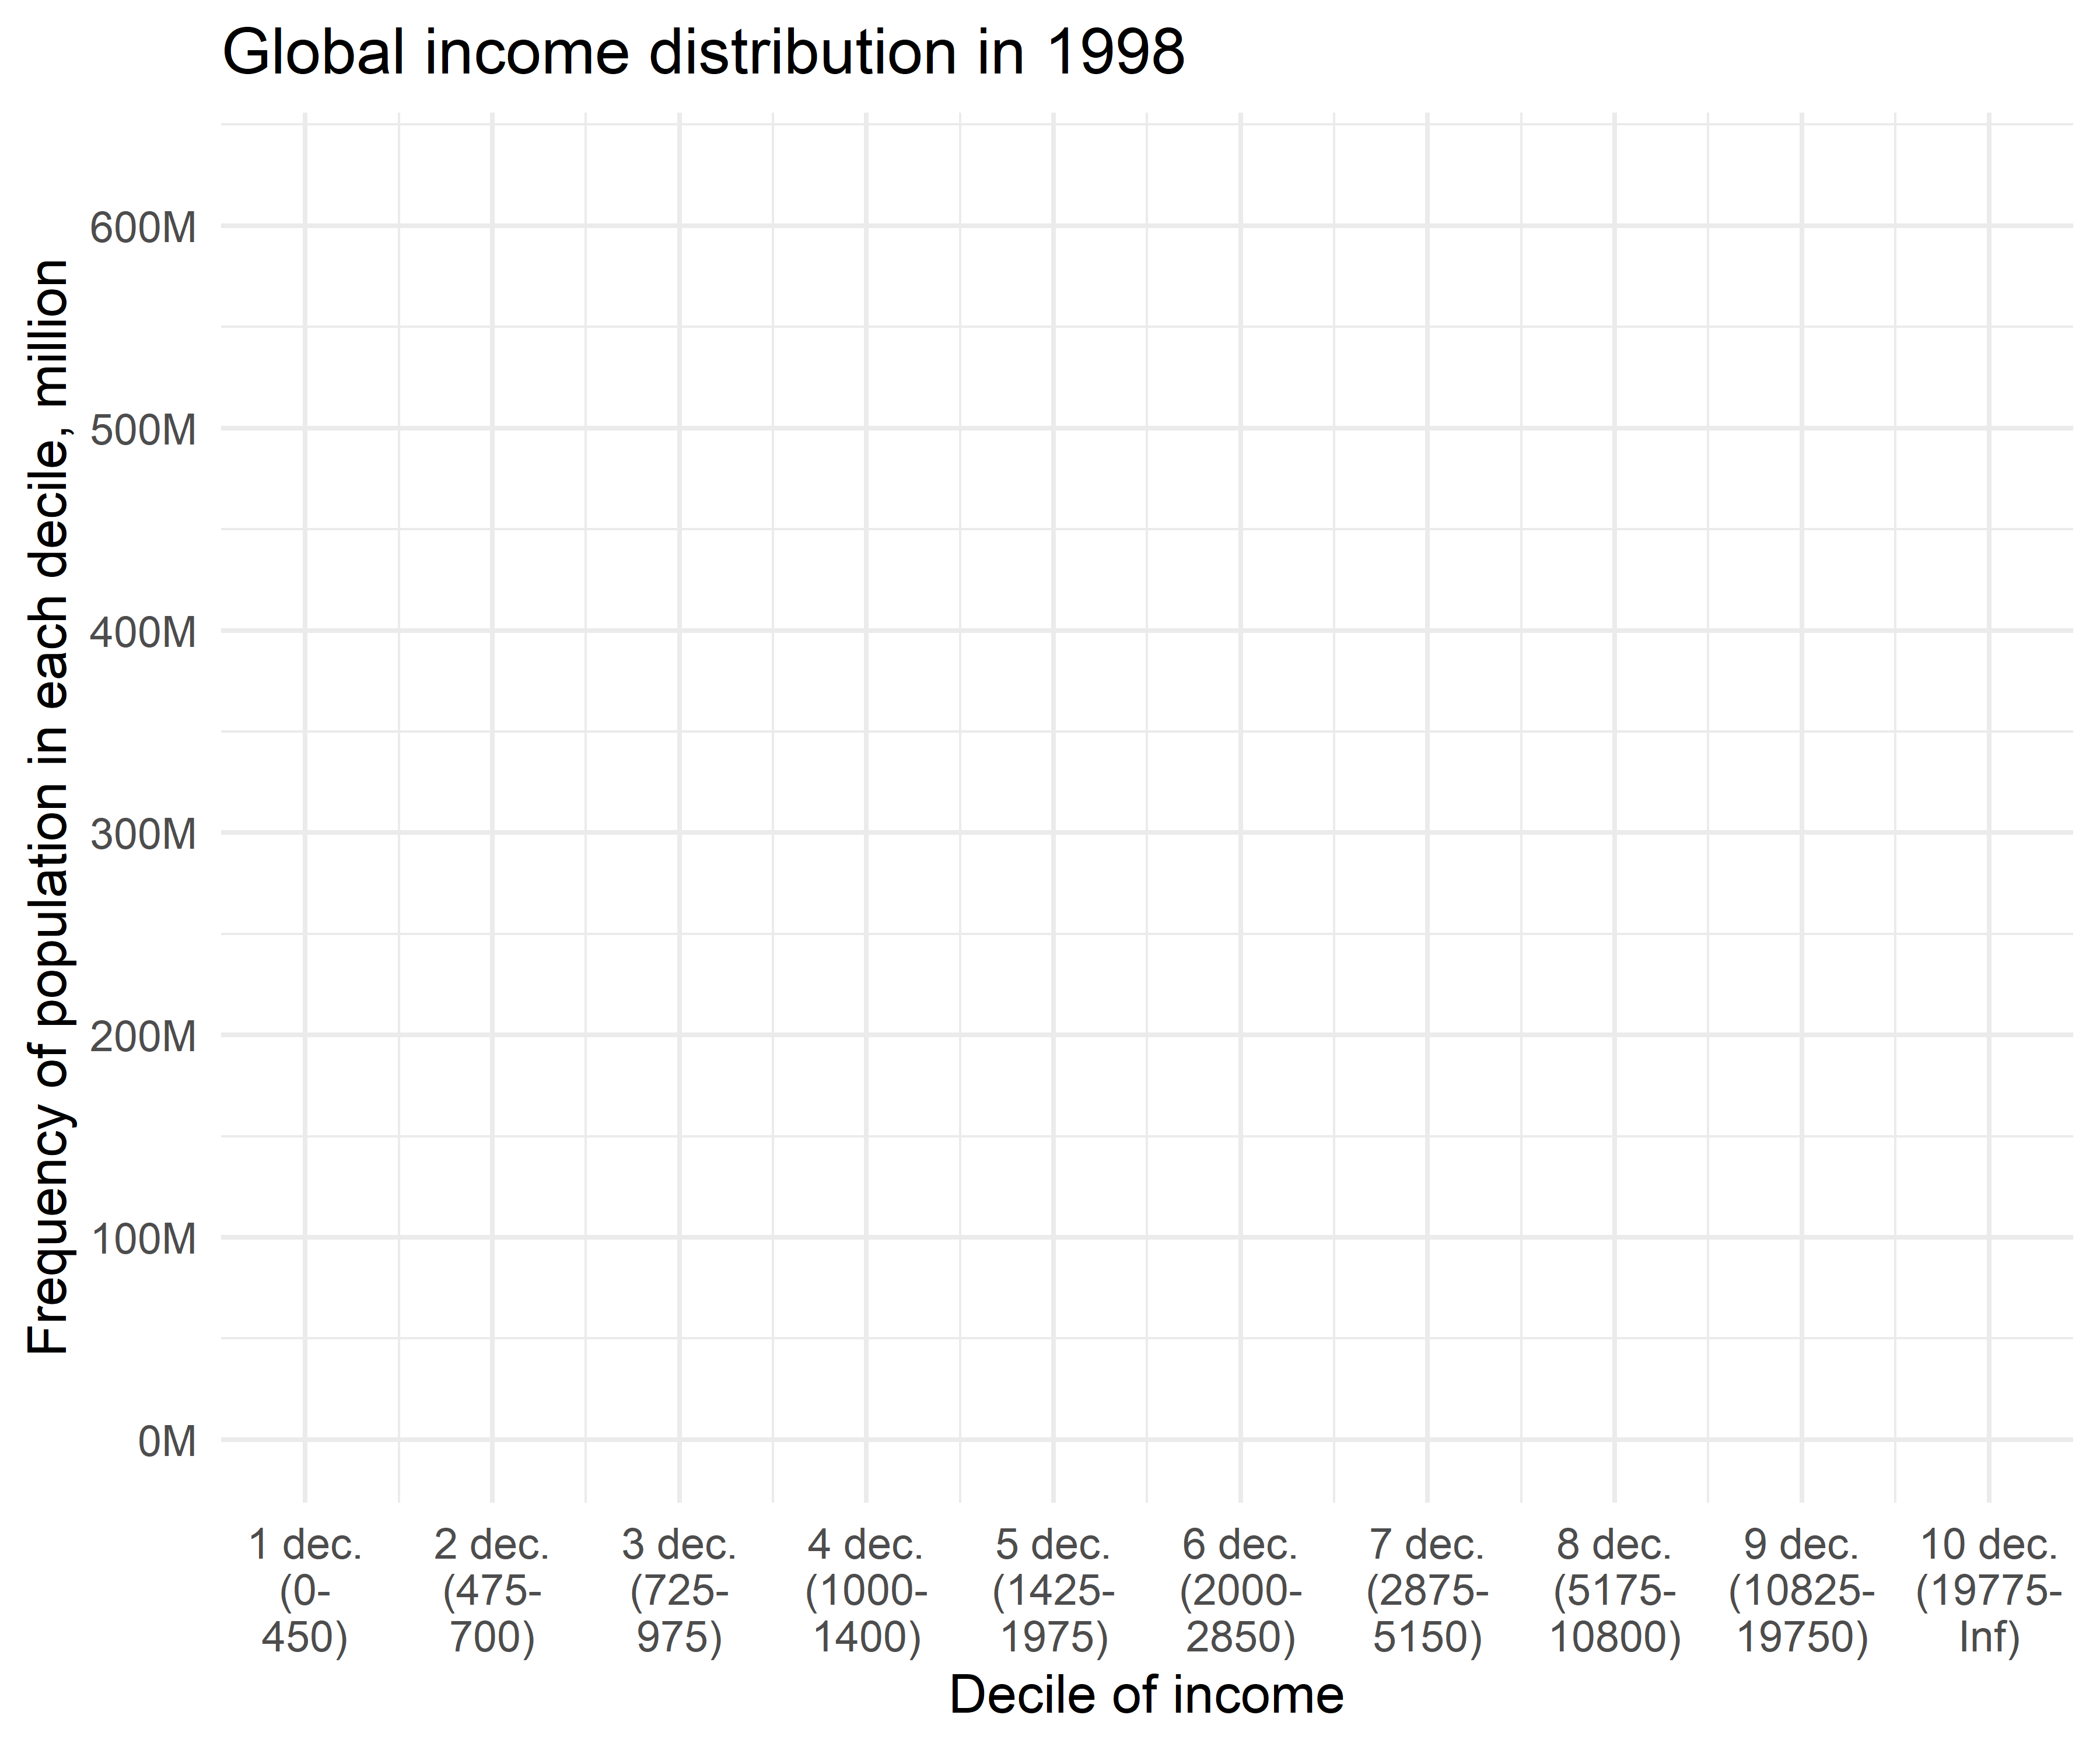
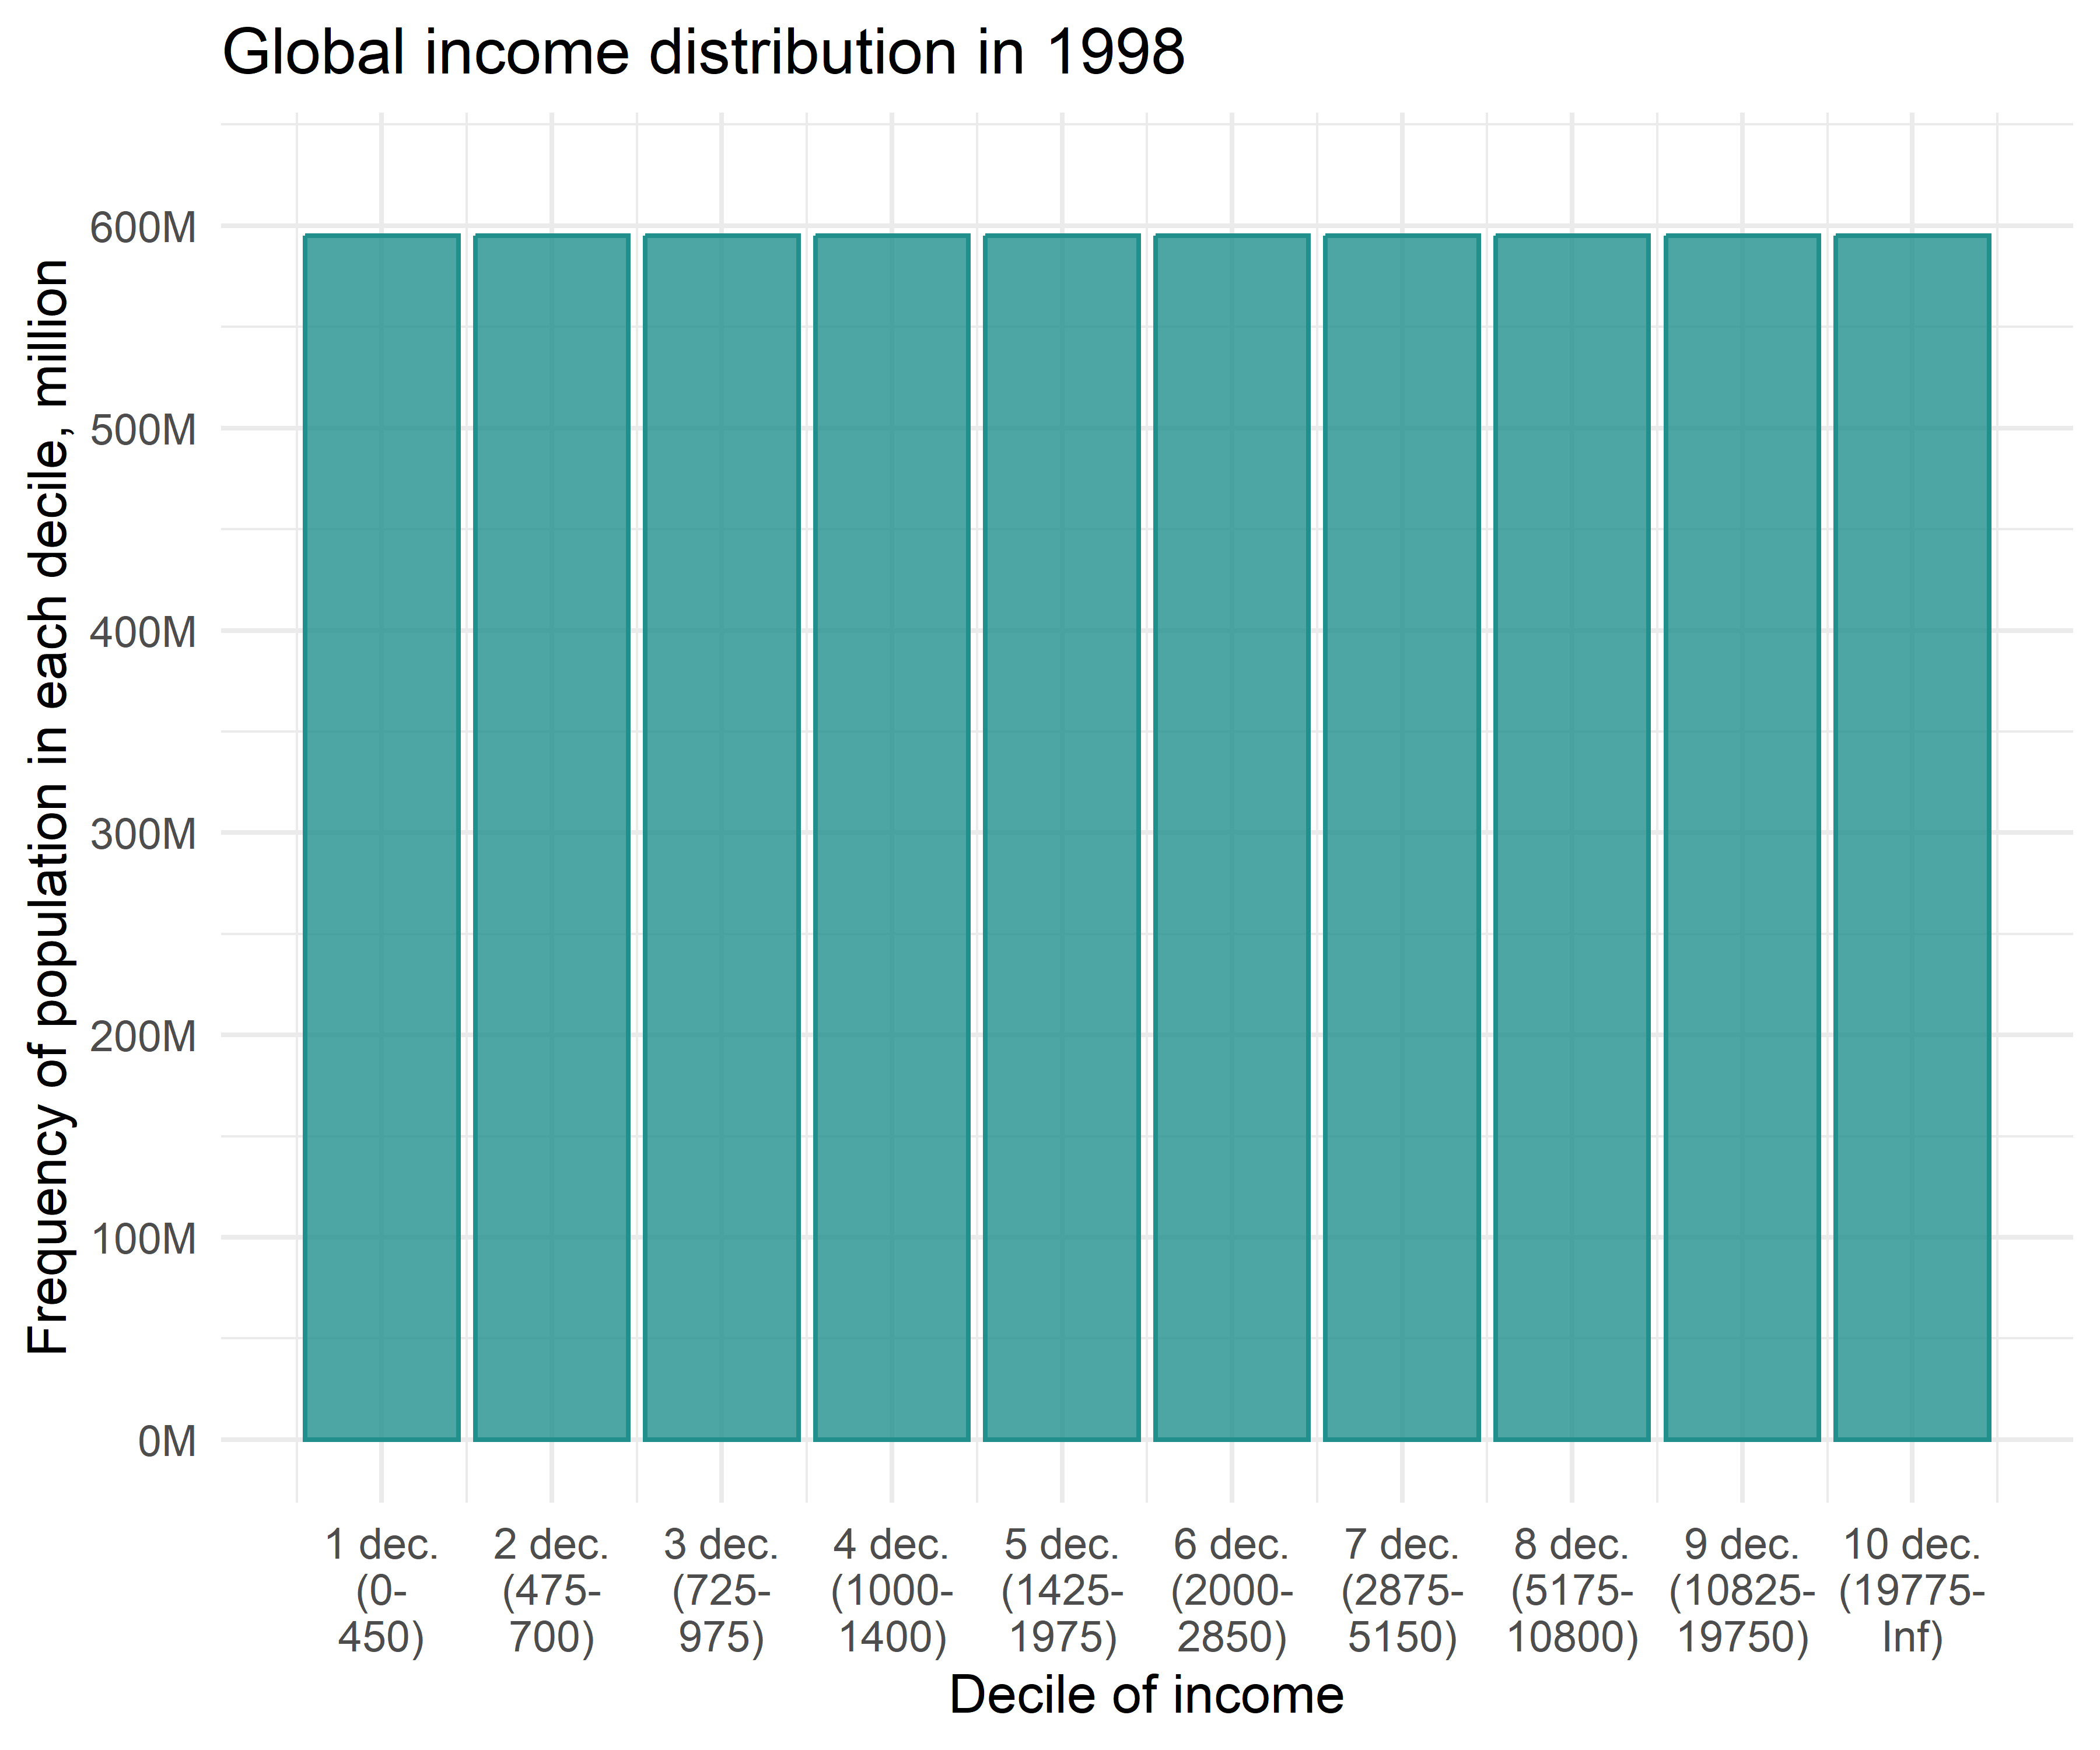
Deciles (3). New insights
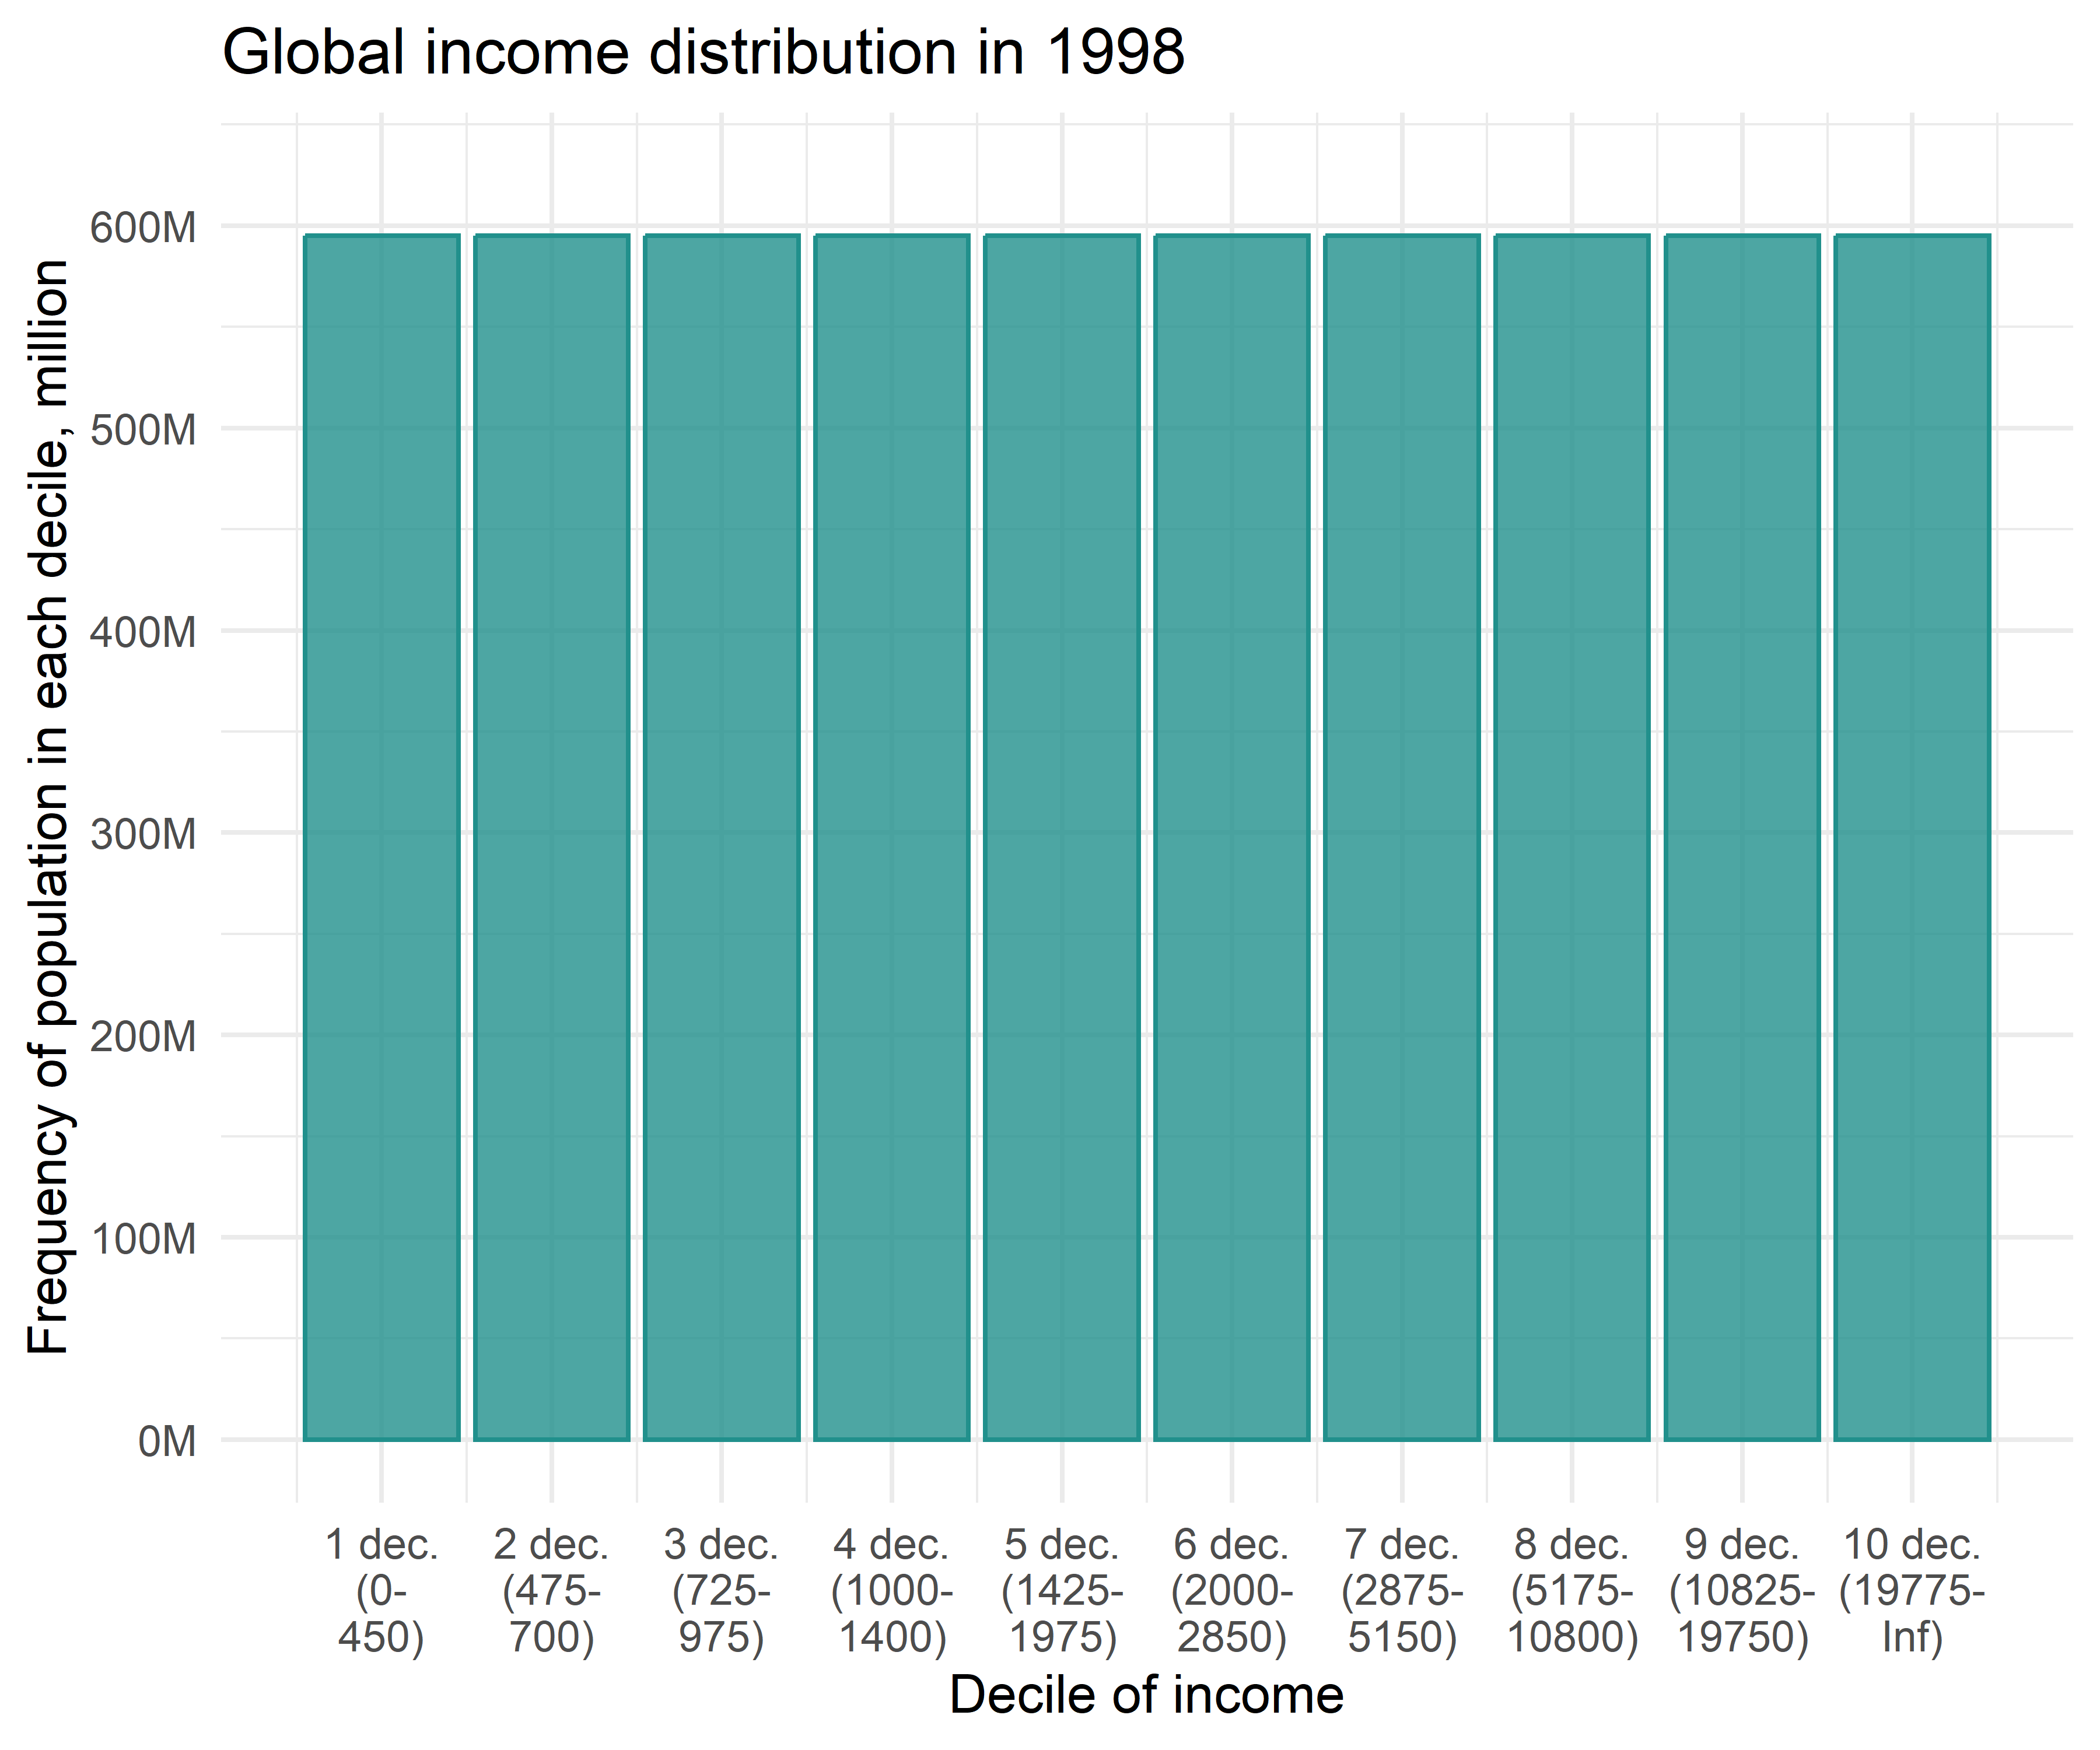
Let us plot % share of total income on Y axis.
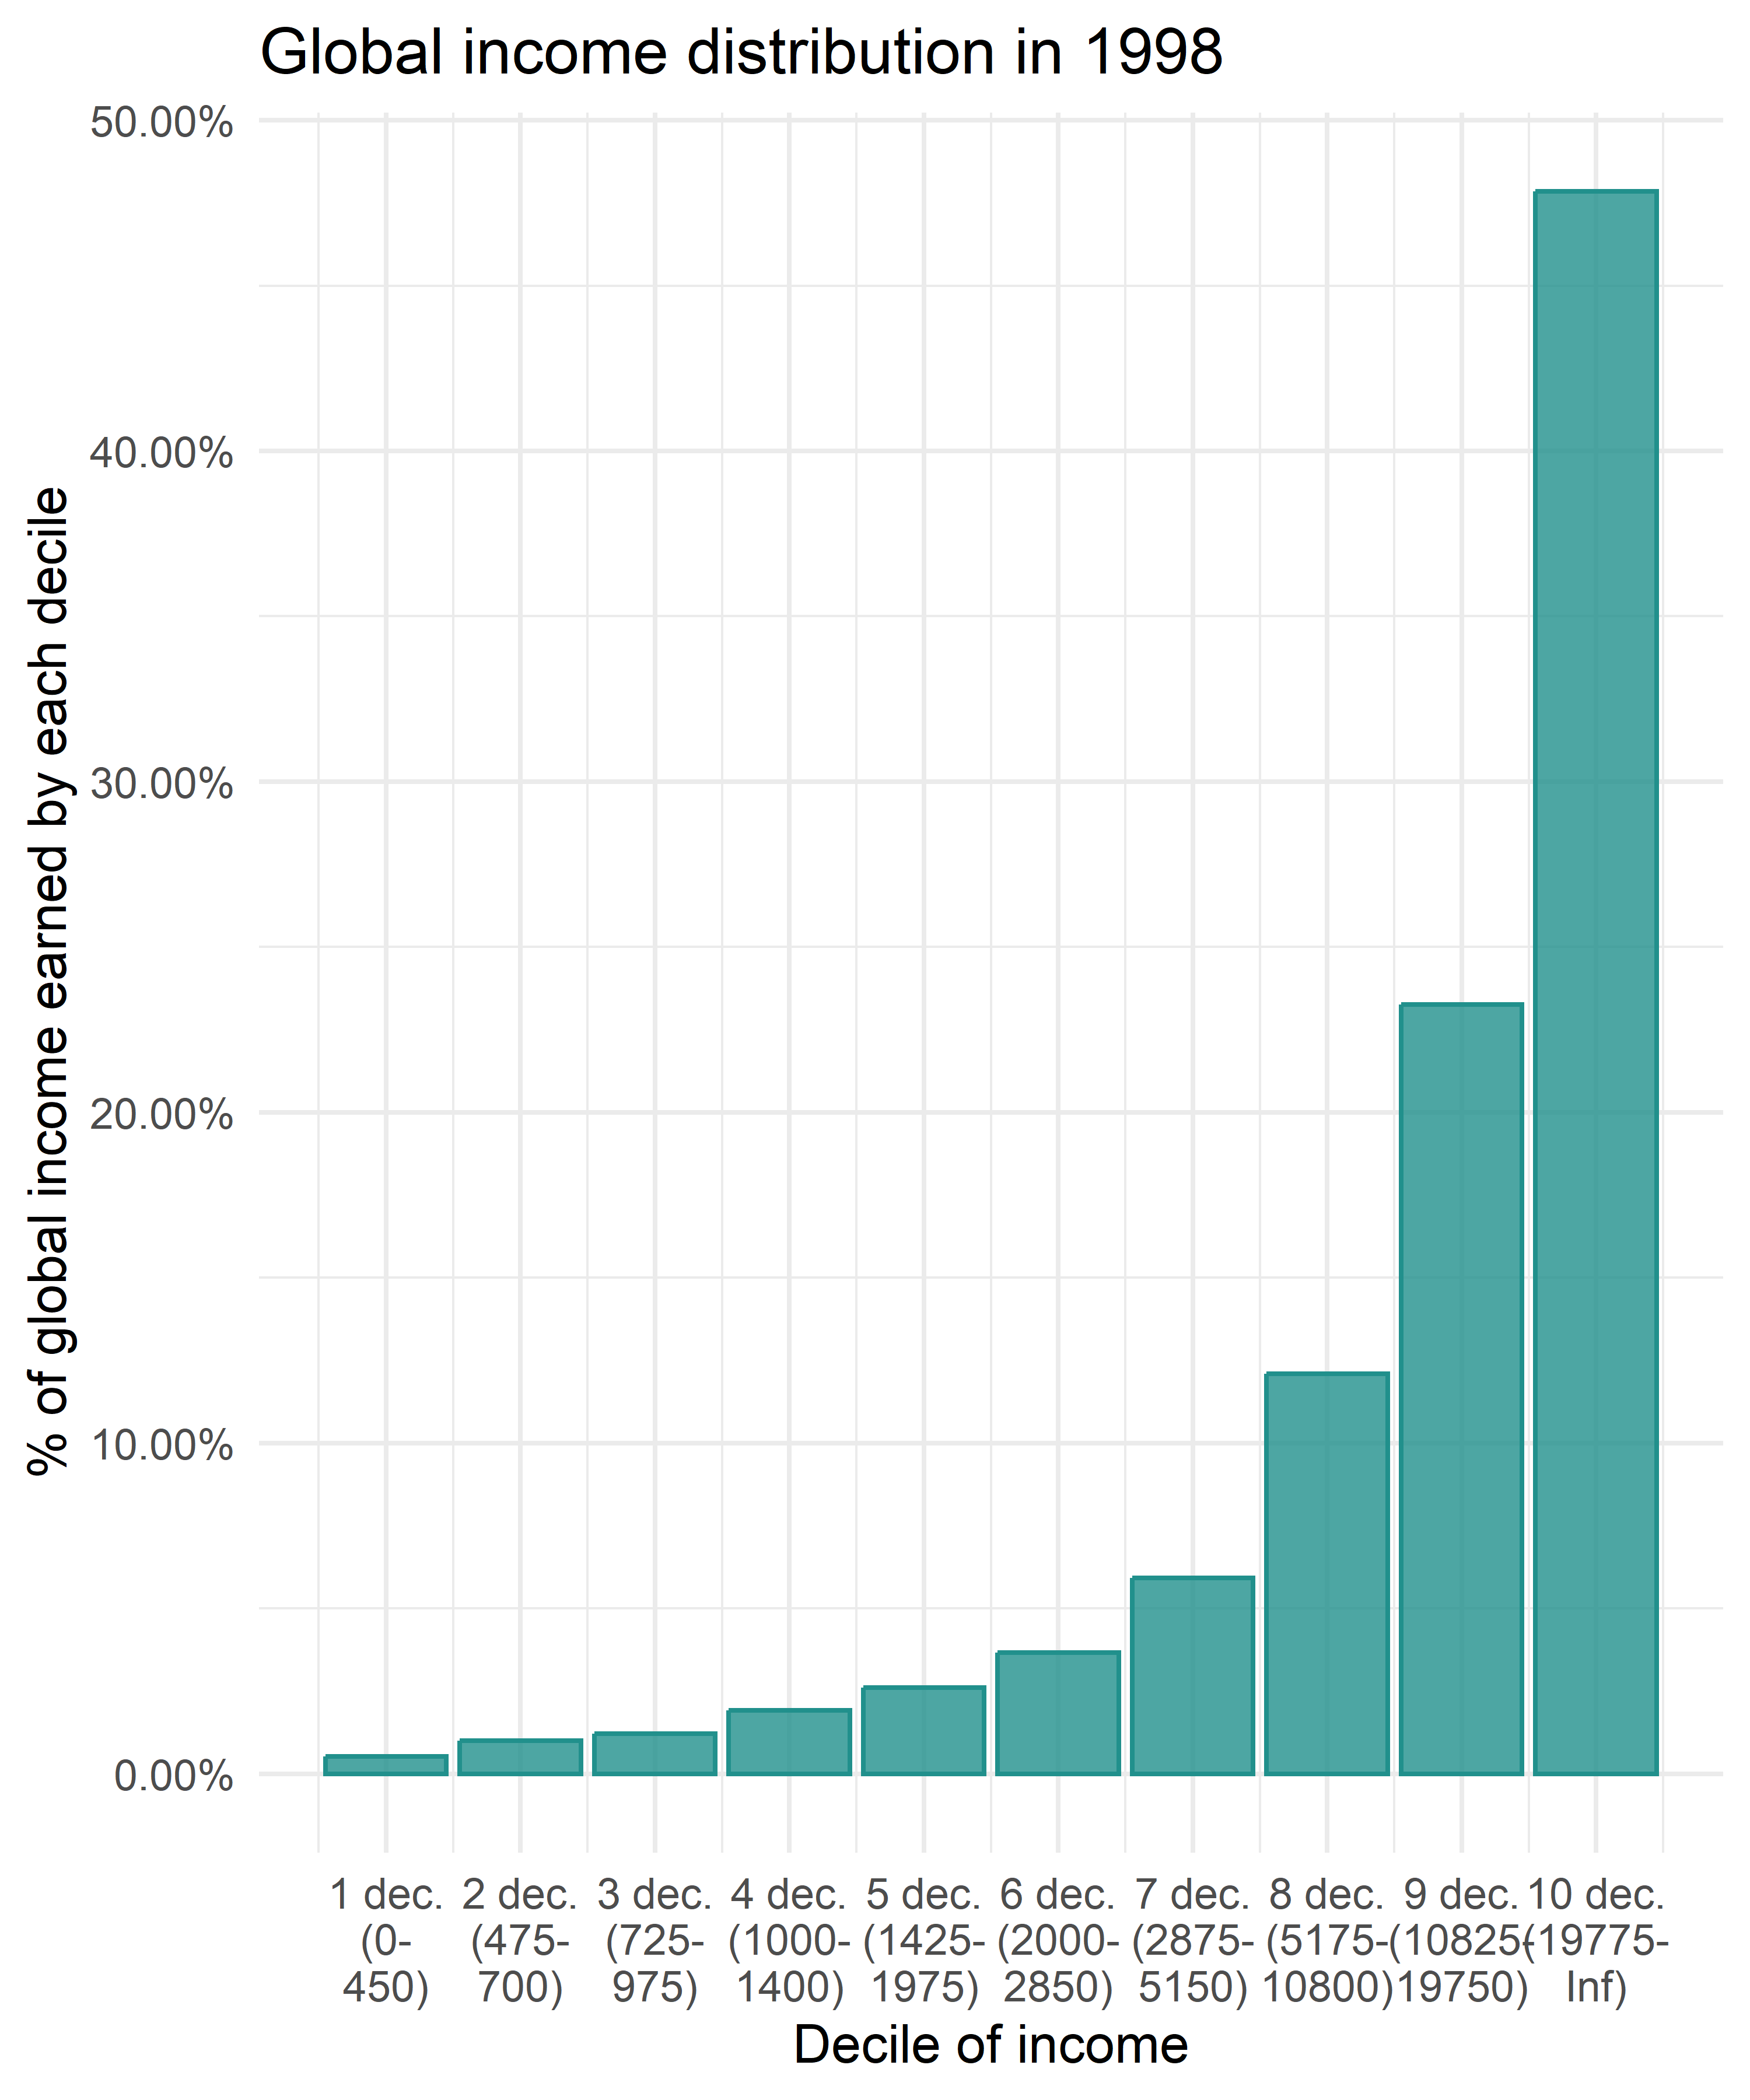
Deciles (4). New insights
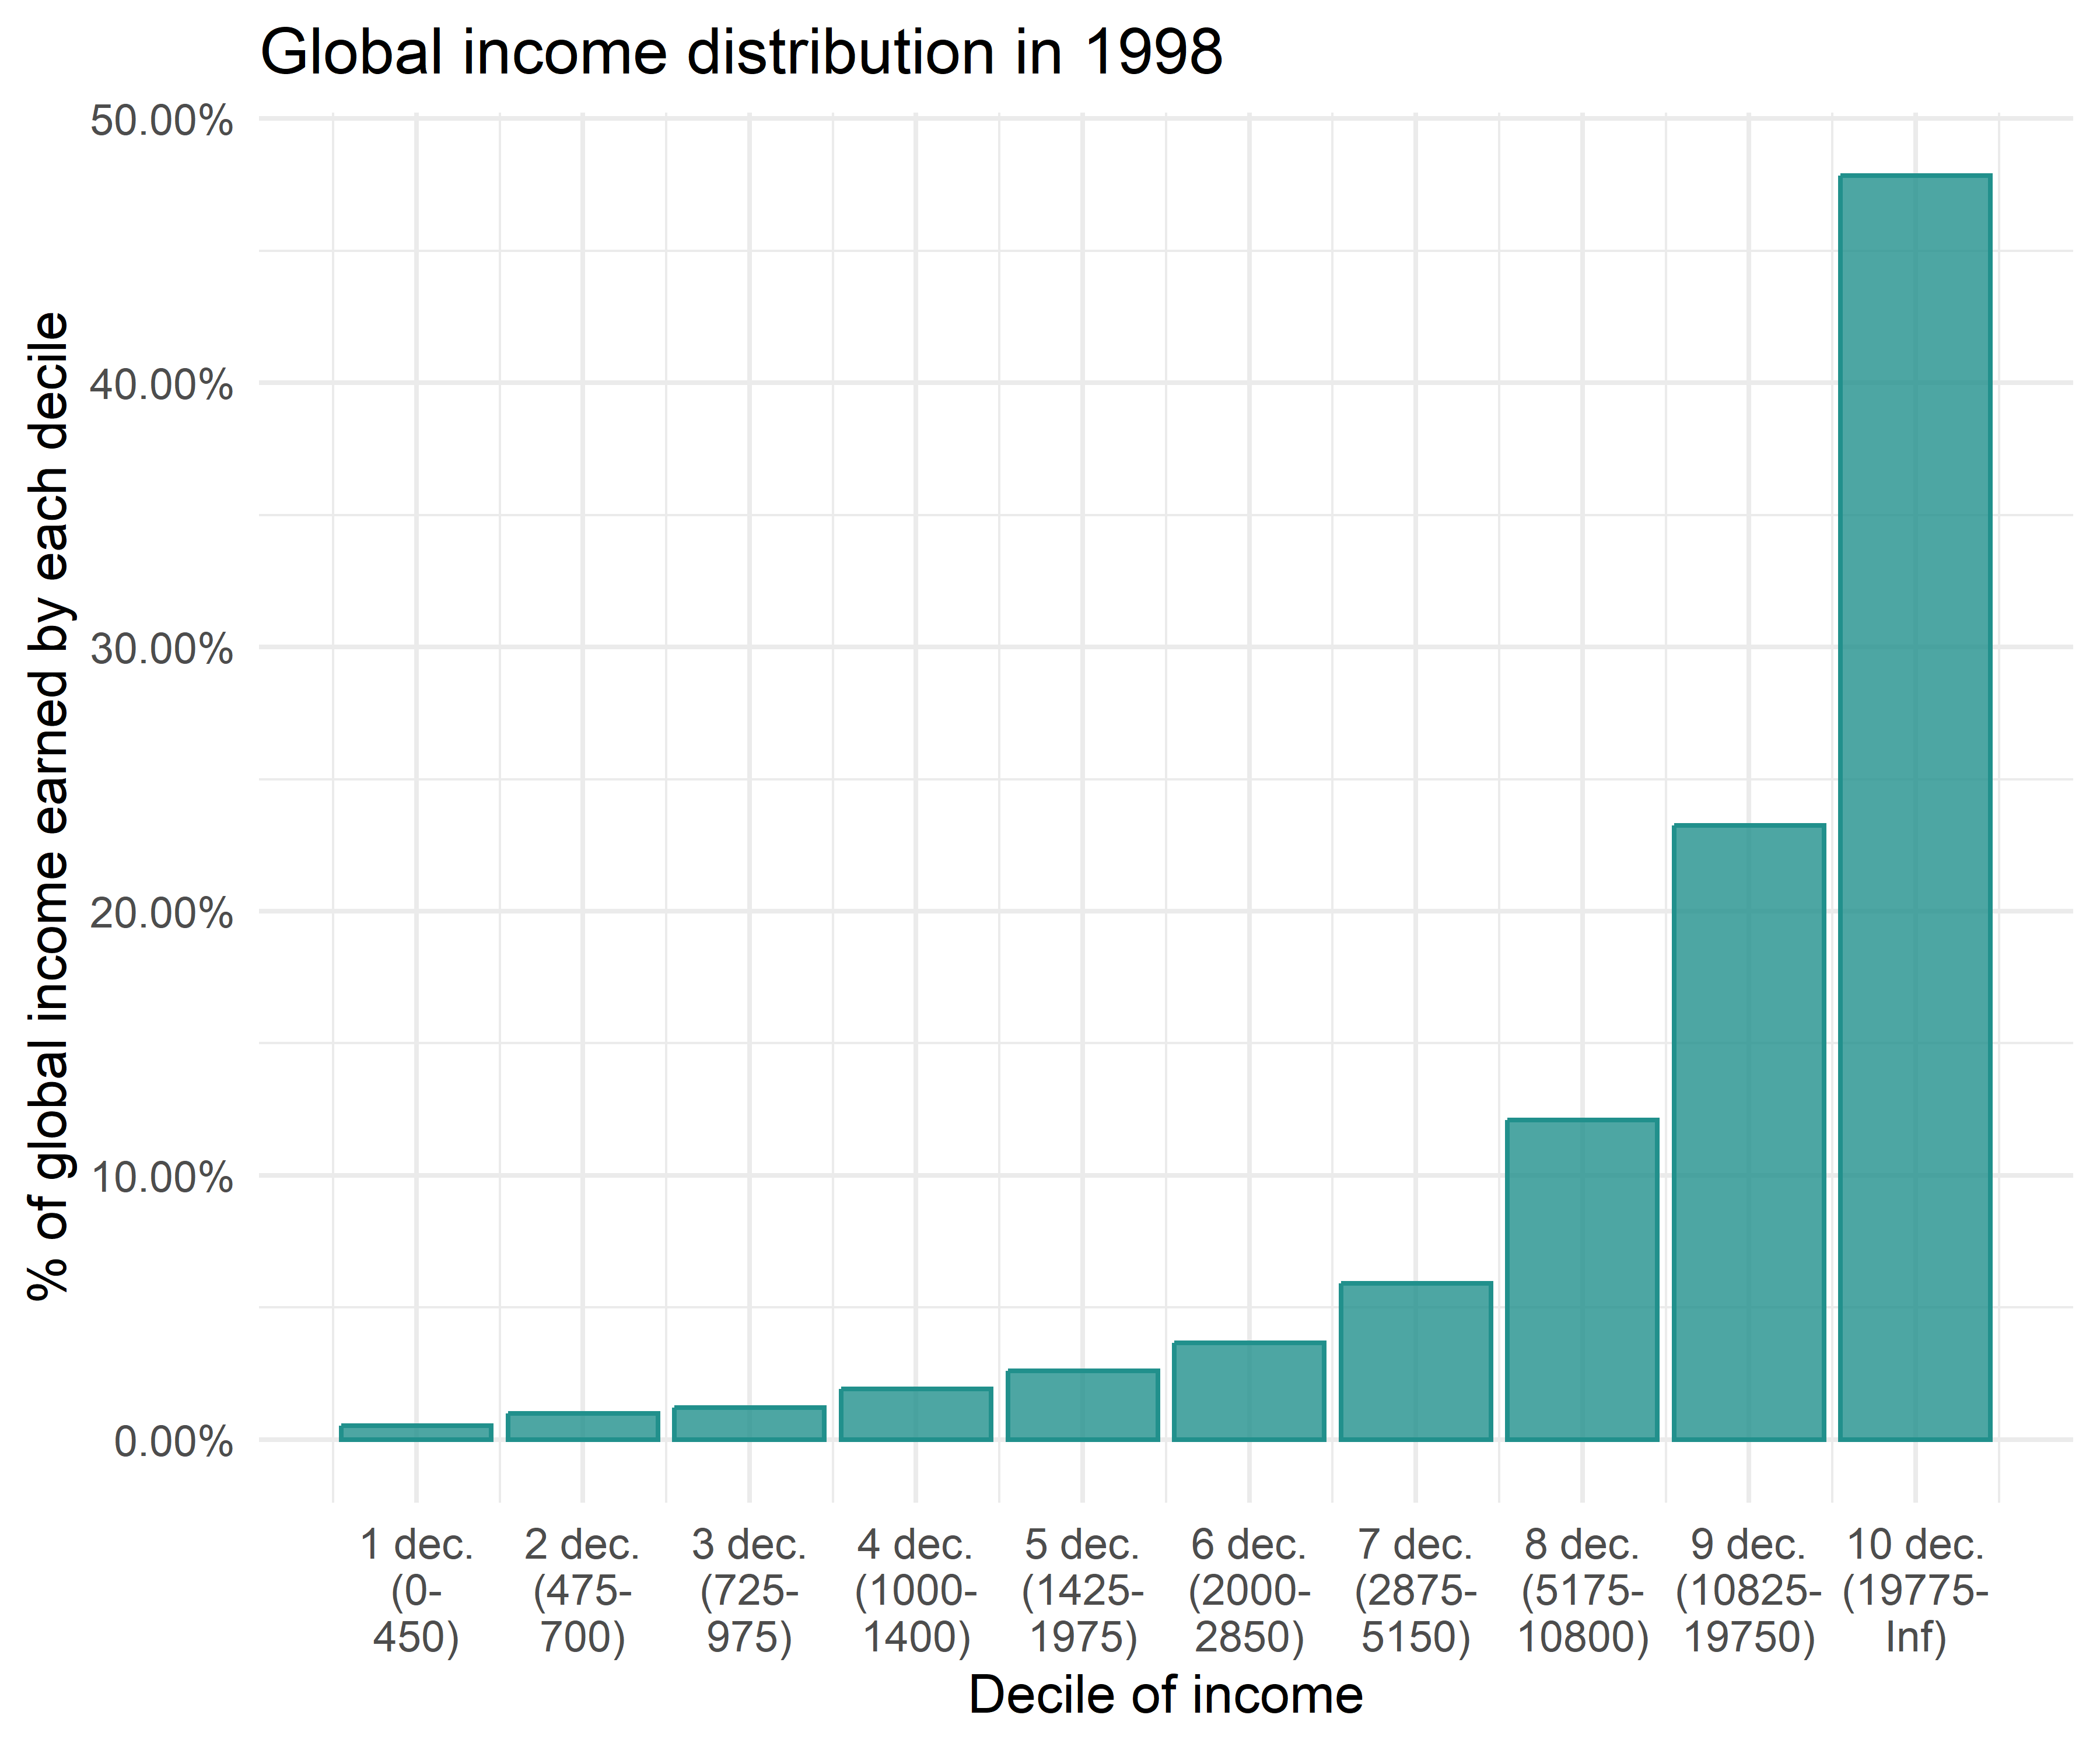
What does it show?
Where is the global income generated and distributed?
Deciles (5). Change over time
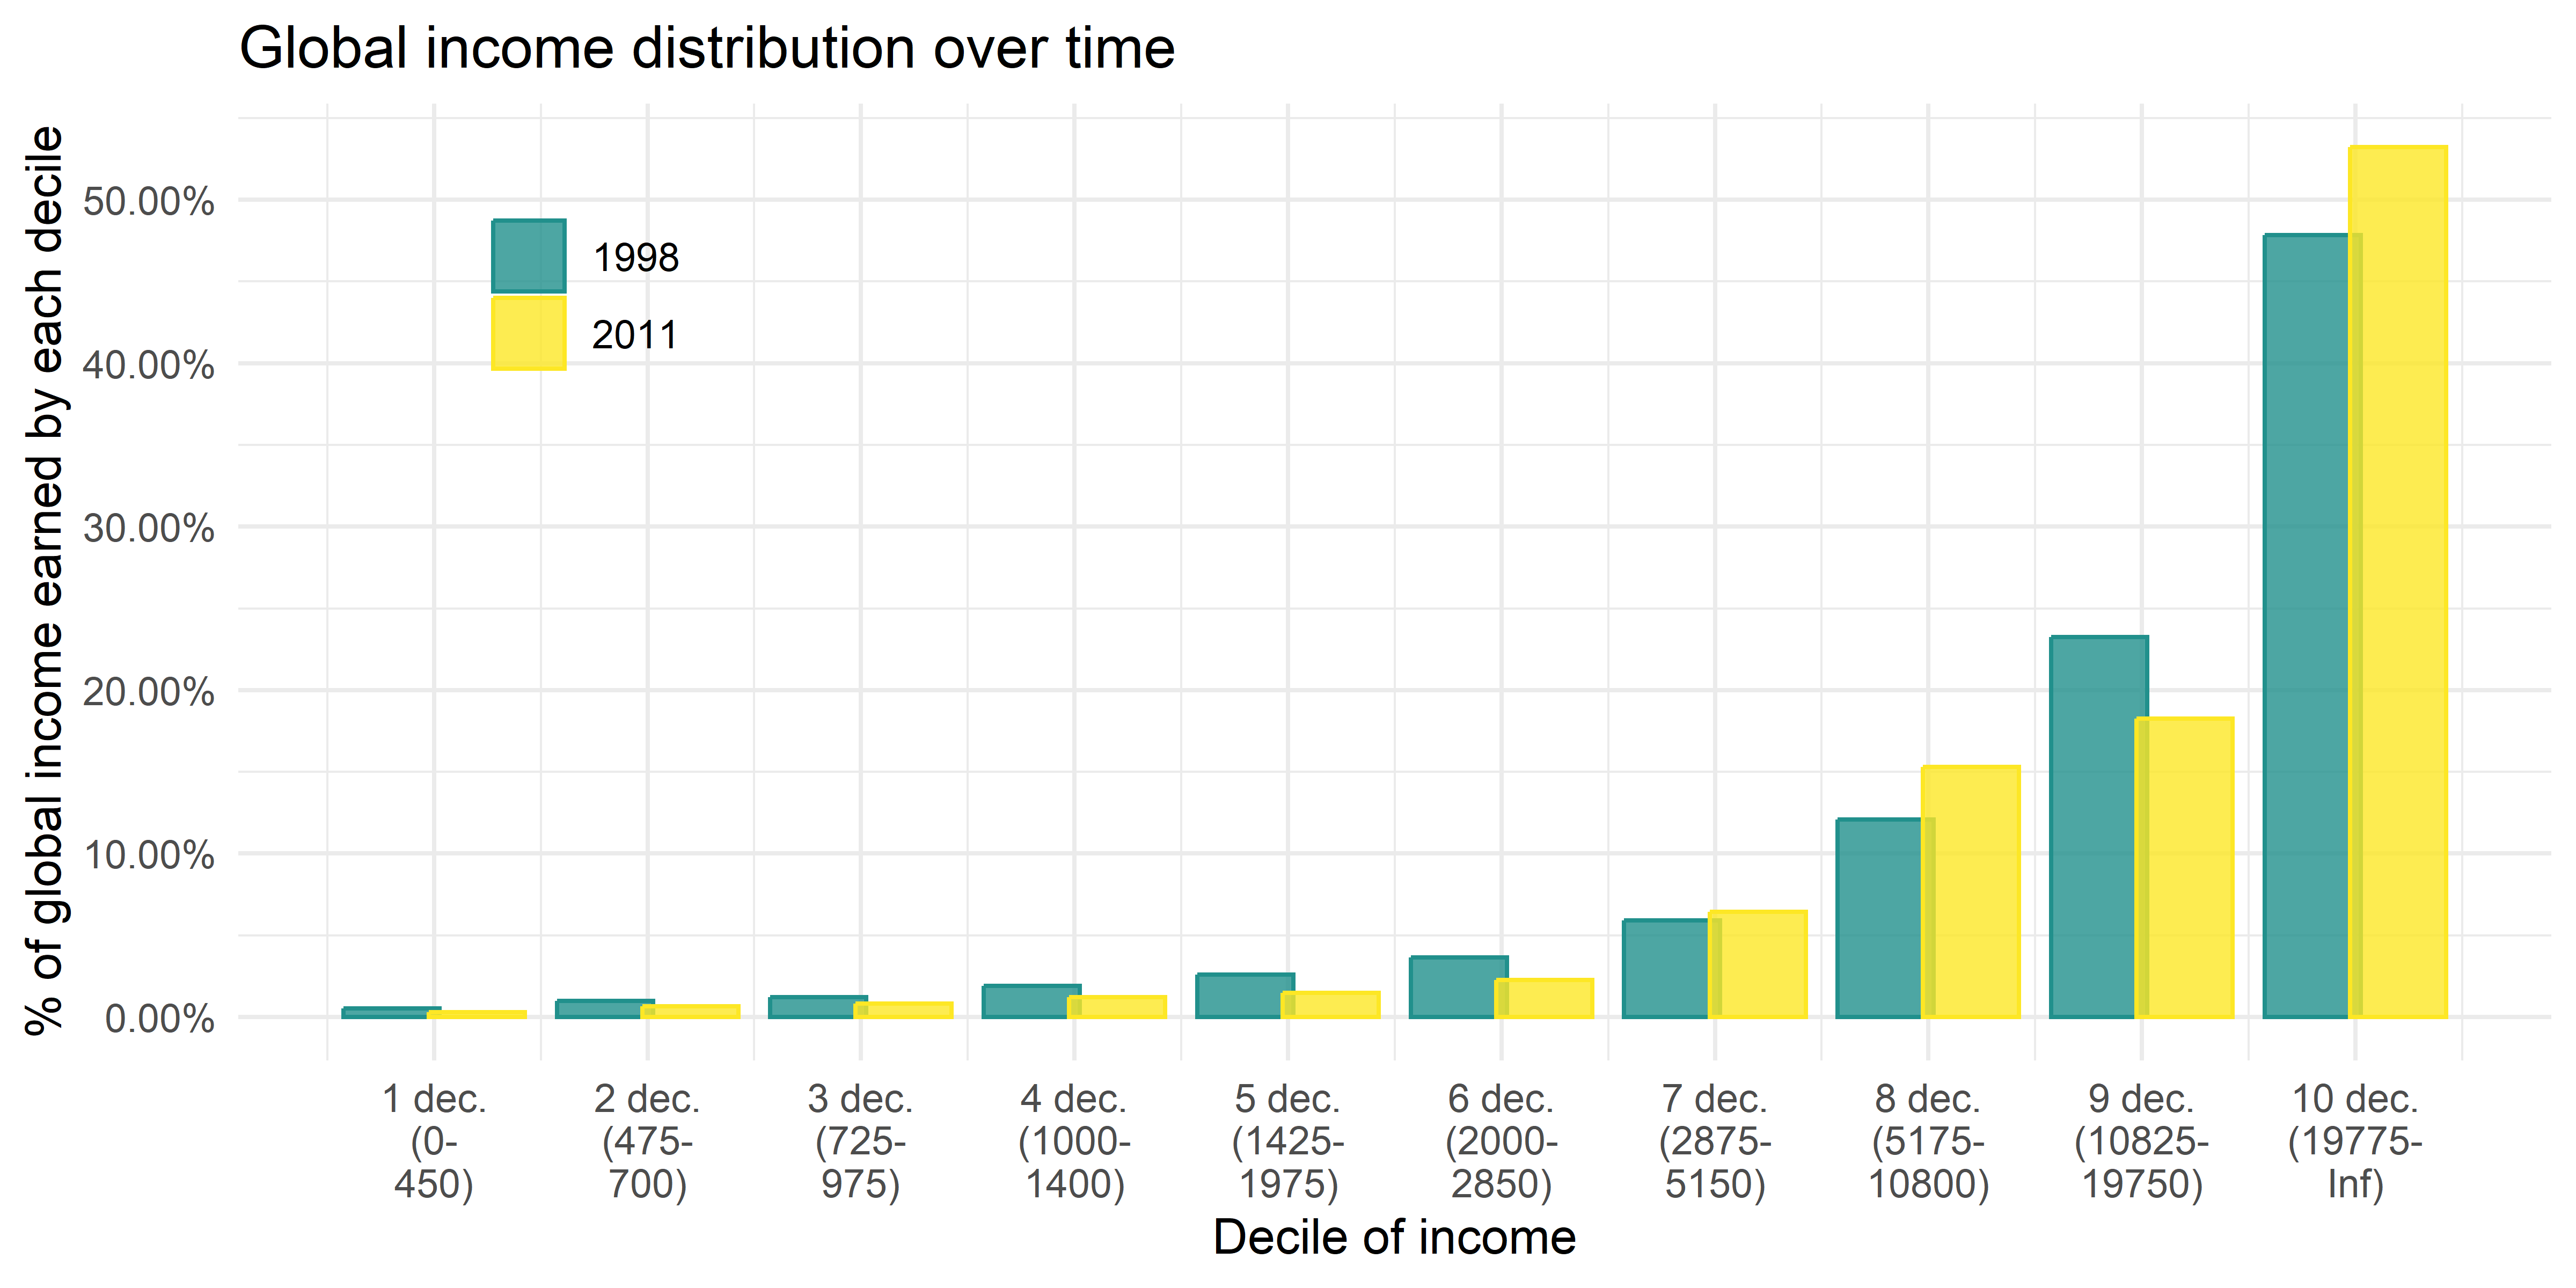
What had changed between 1998 and 2011?
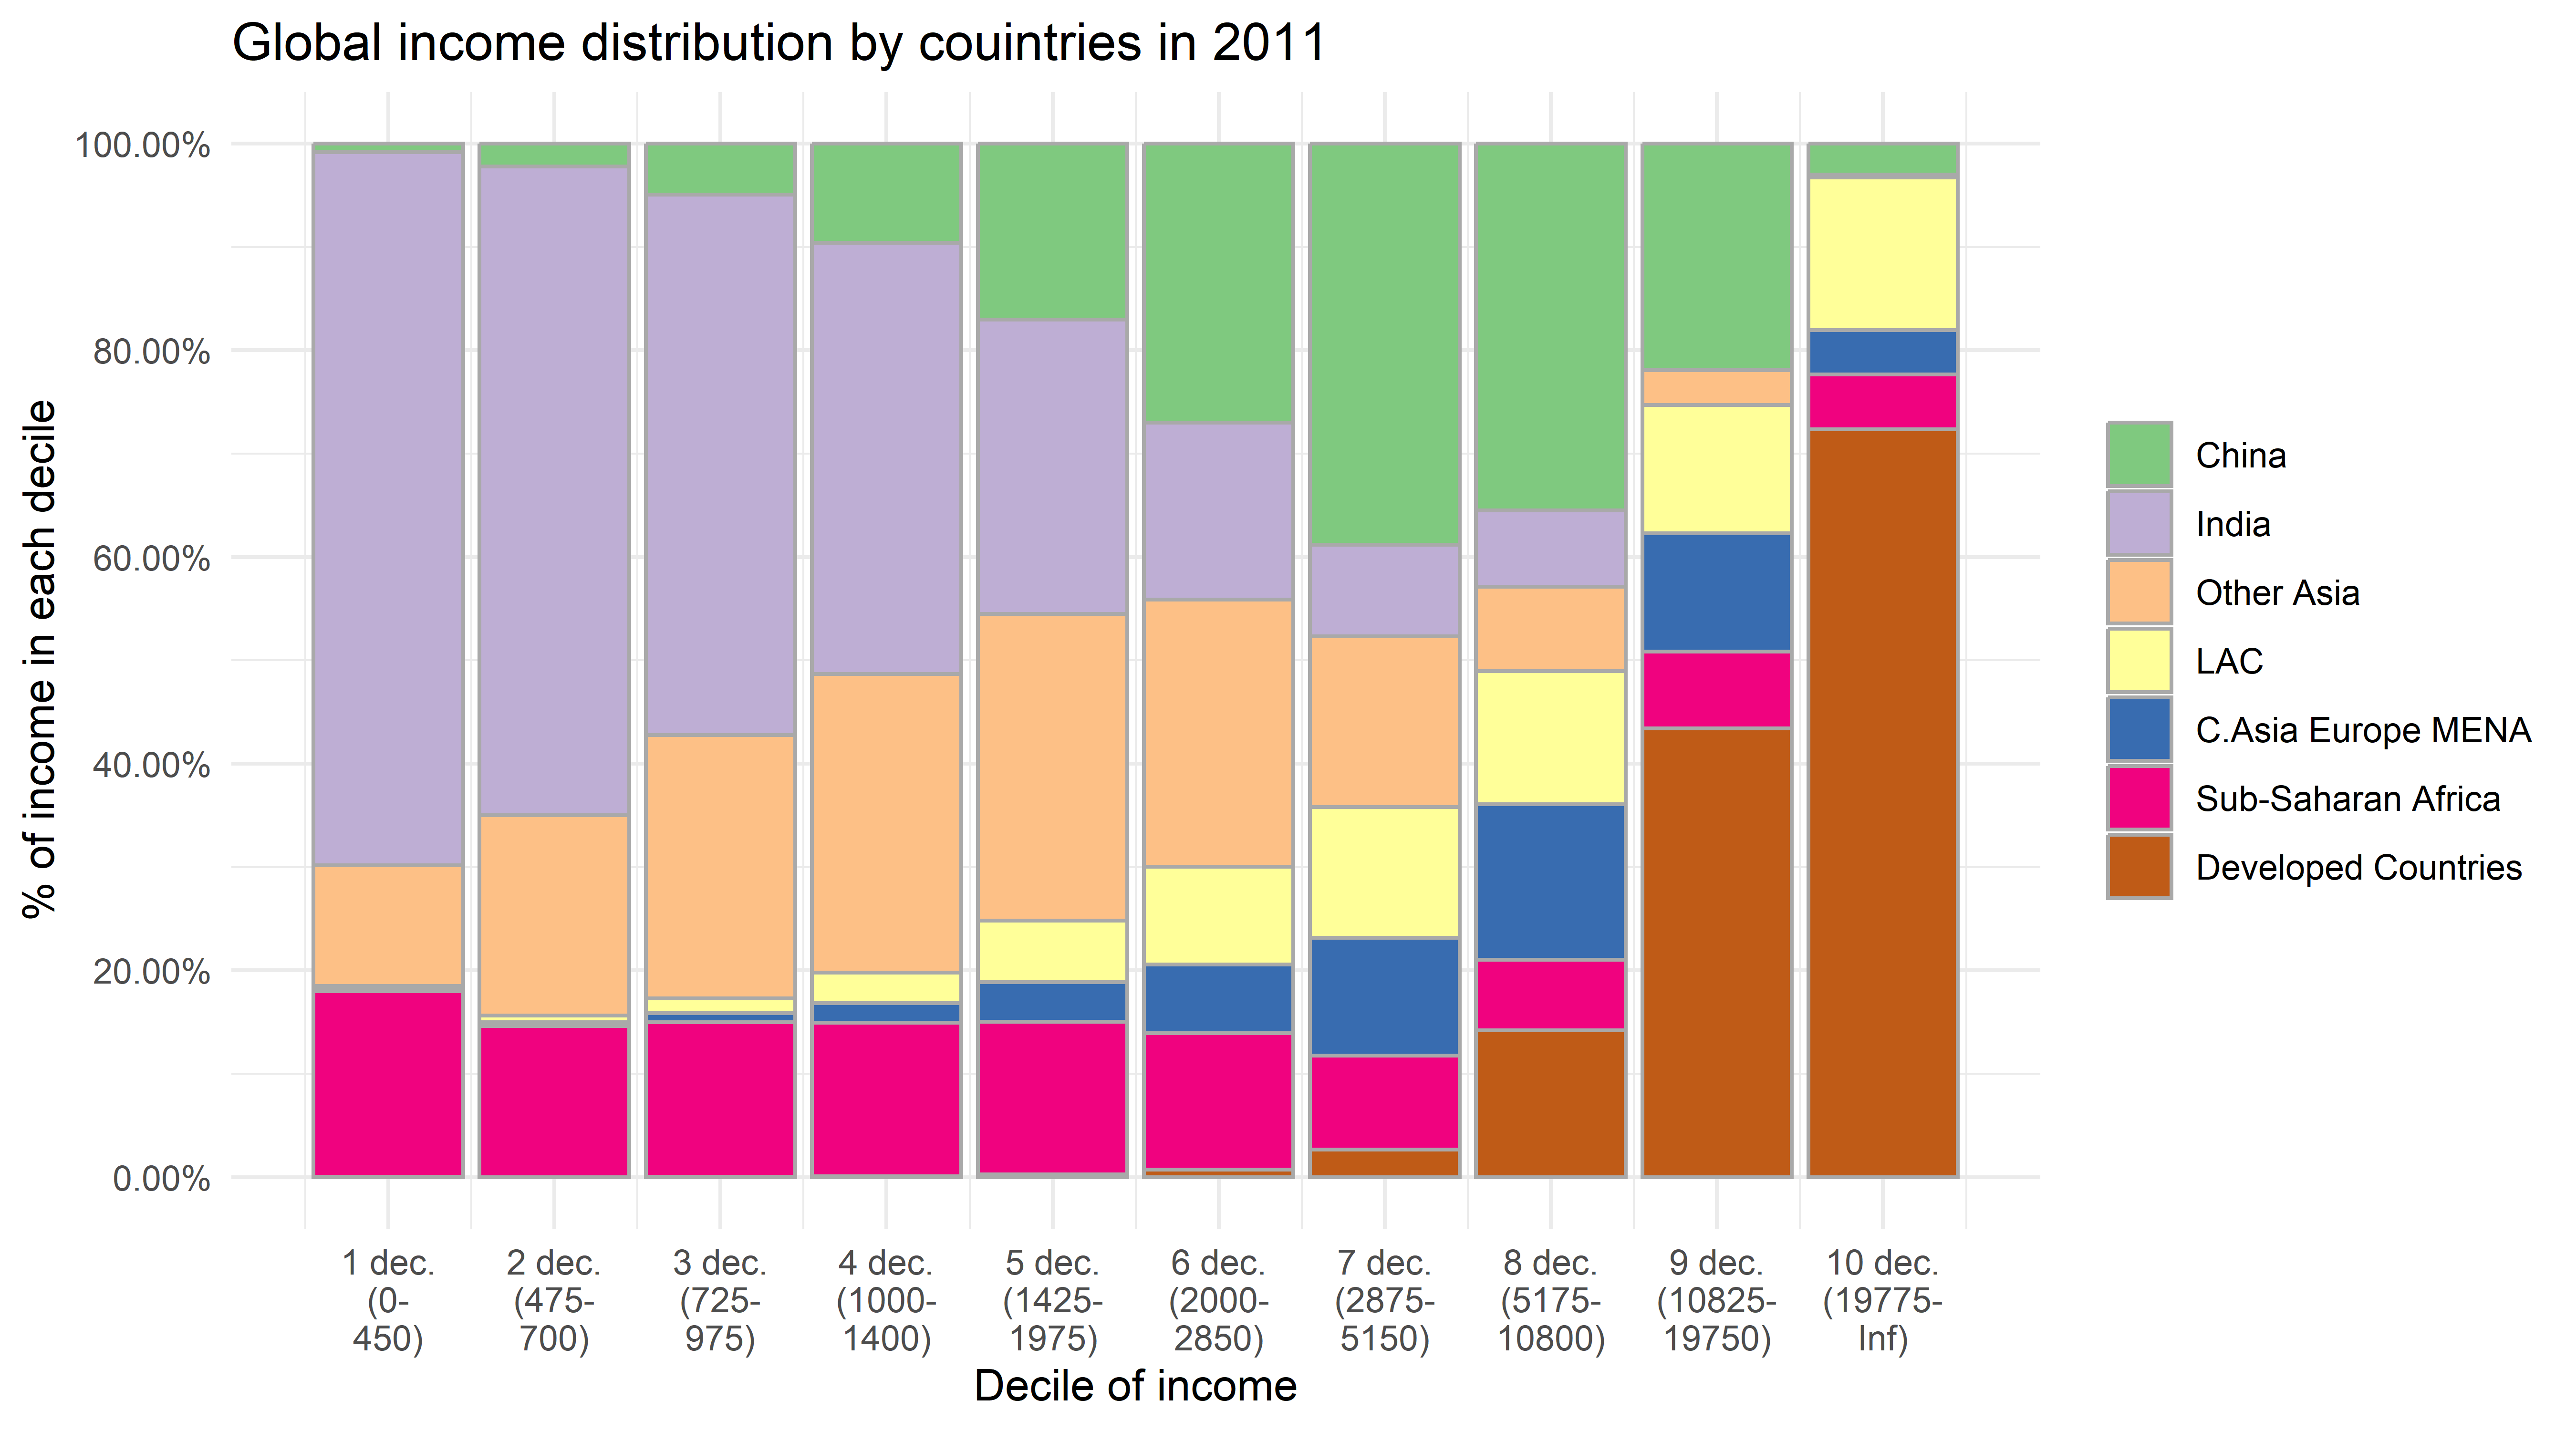
Deciles (6). By country
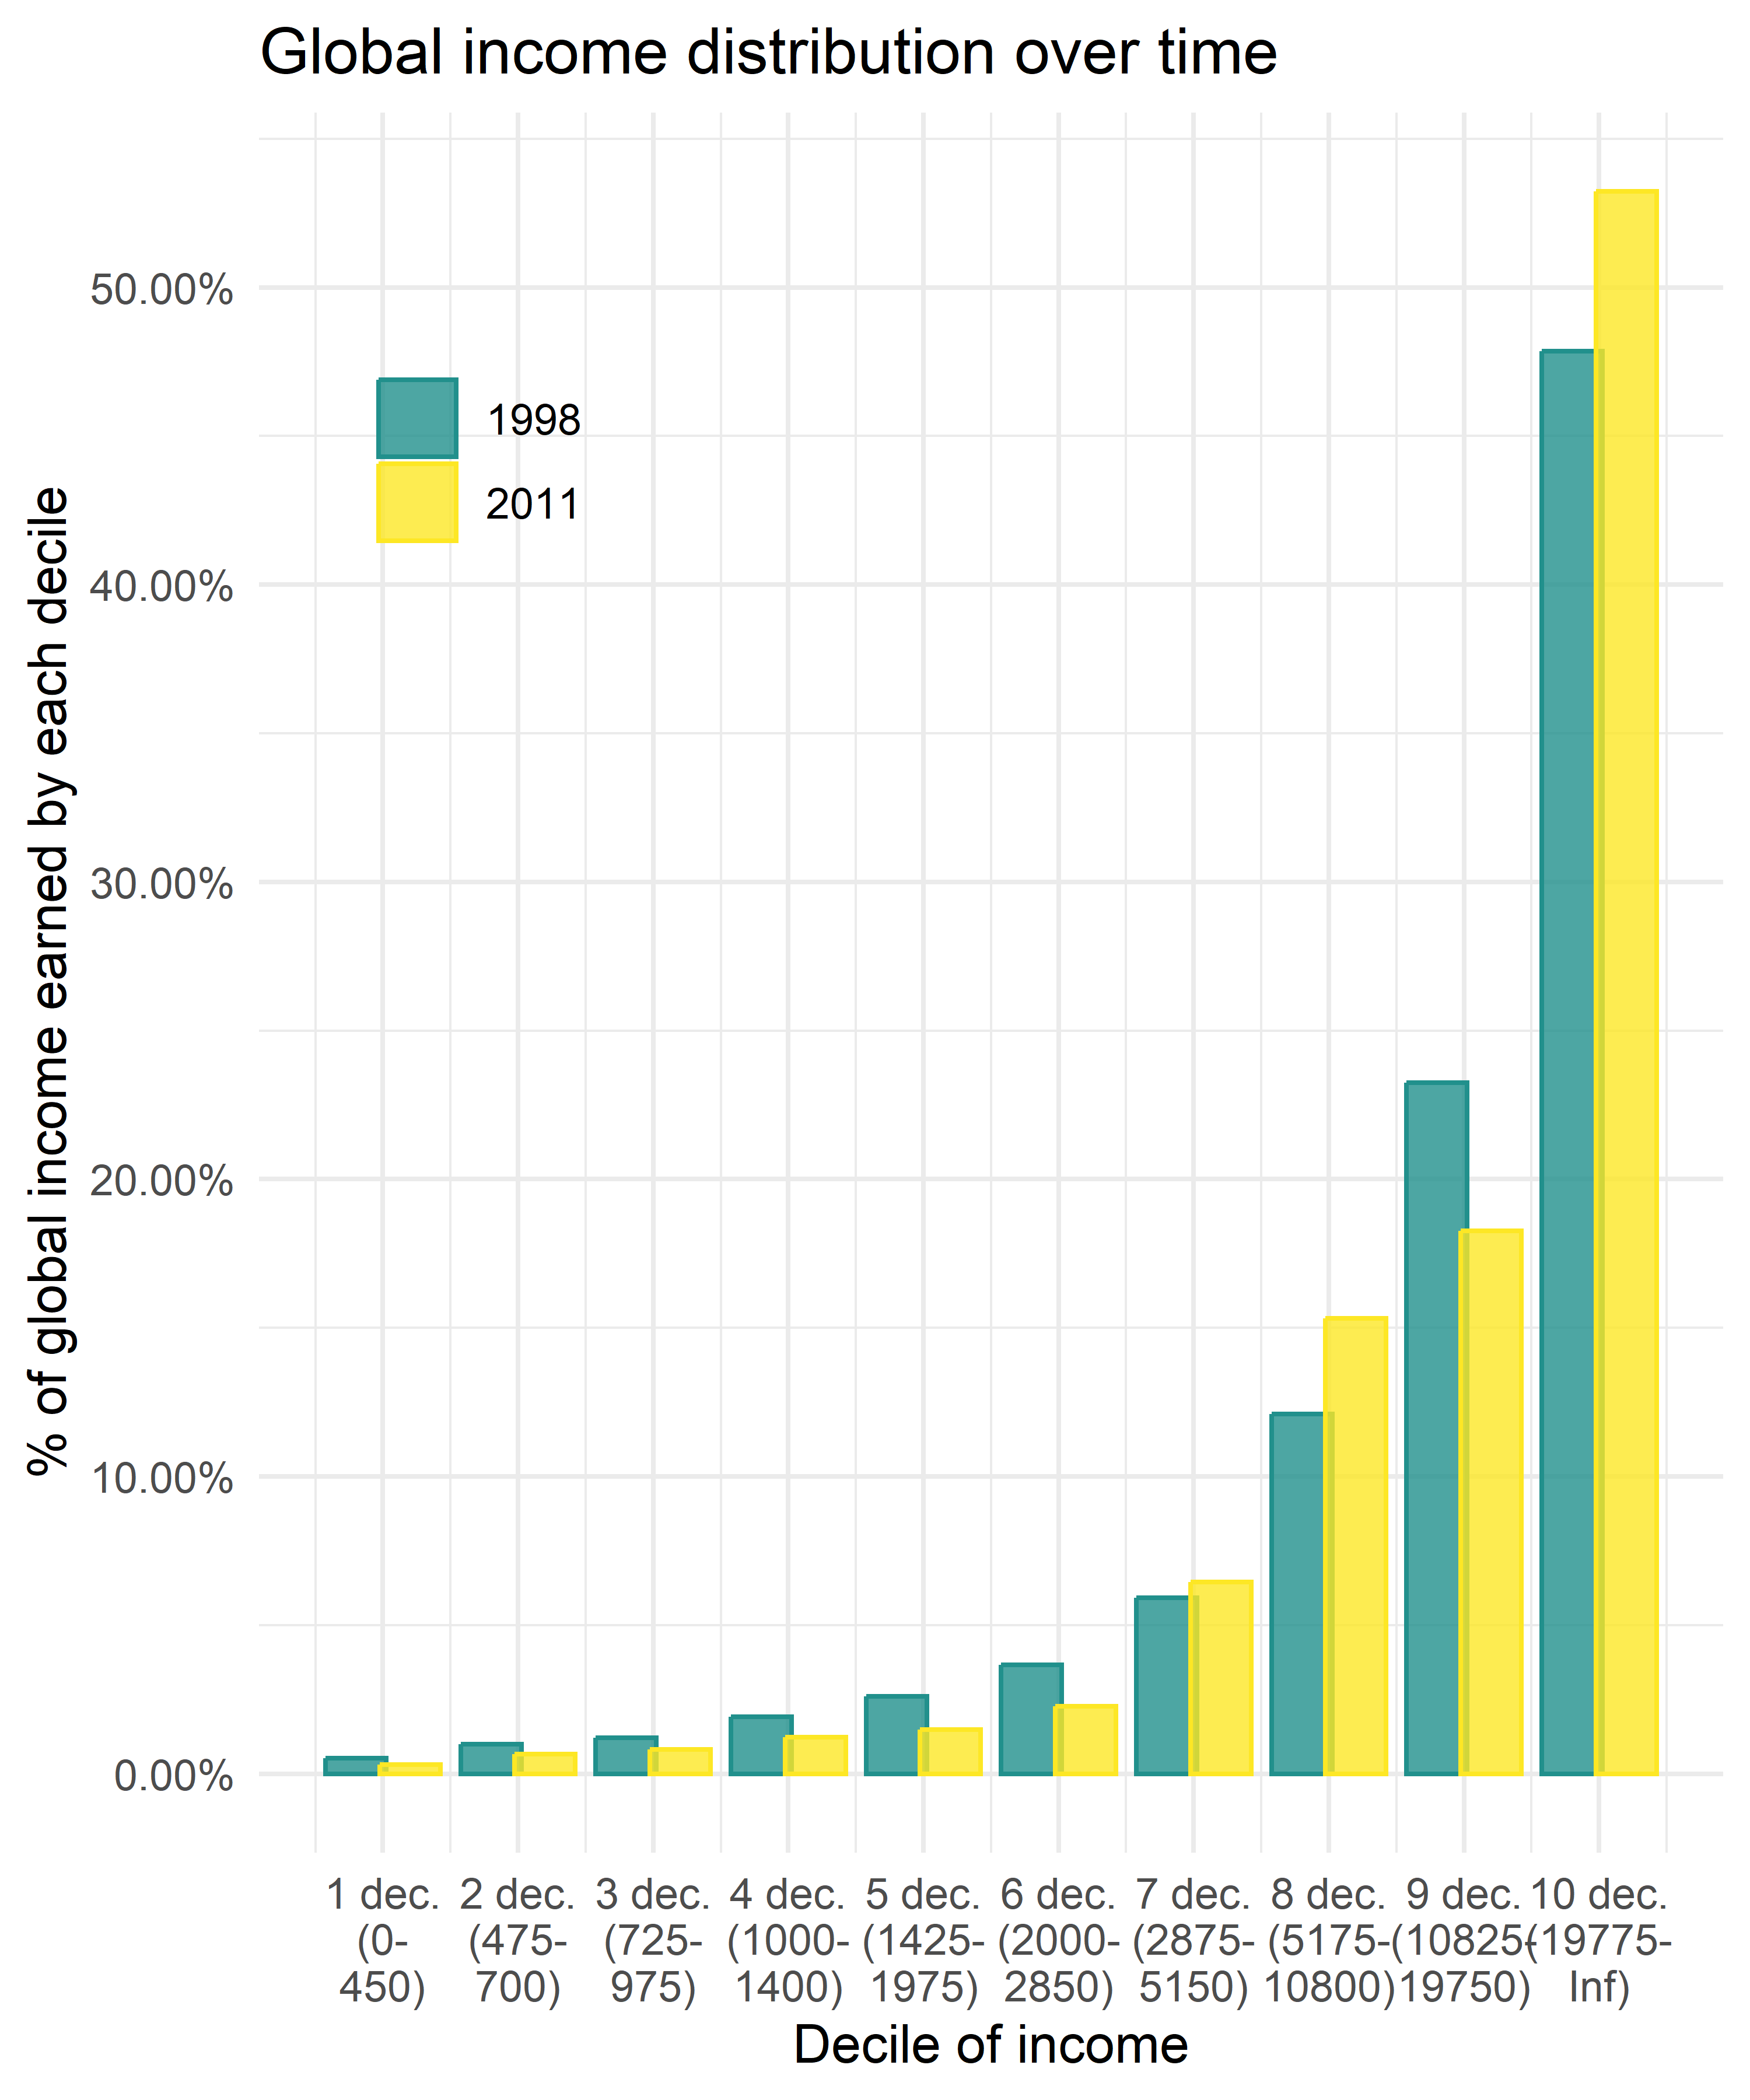
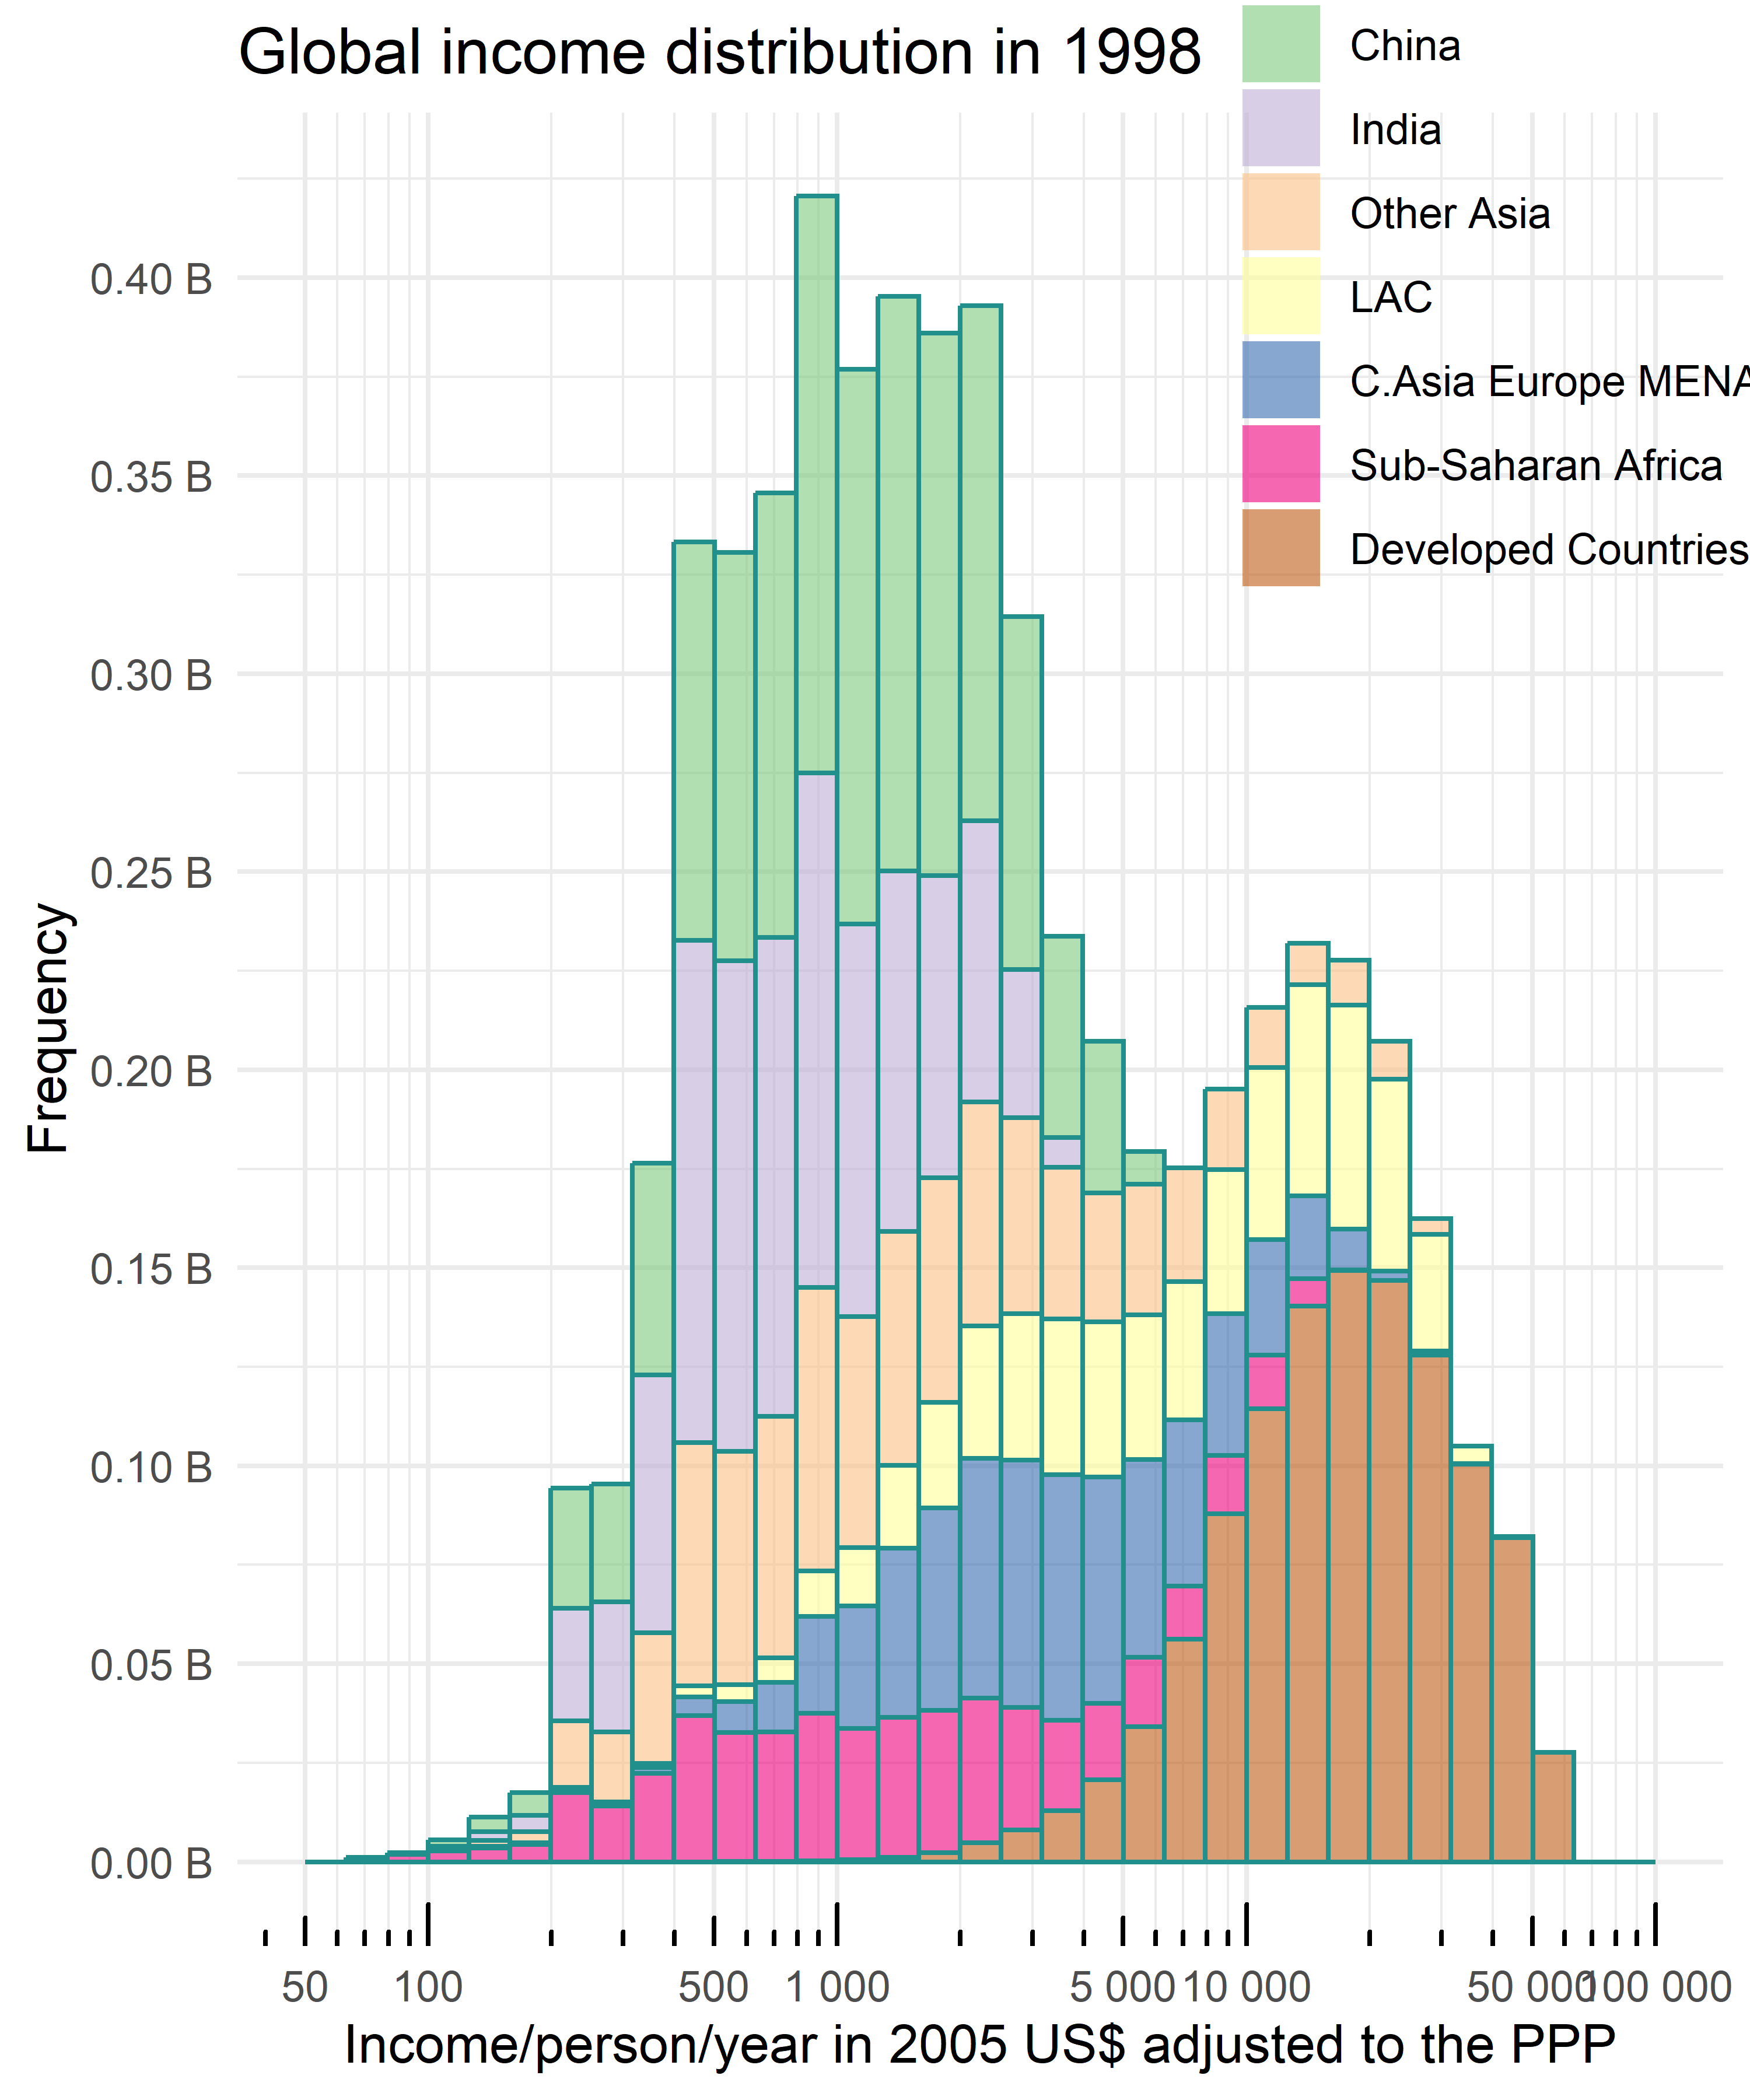
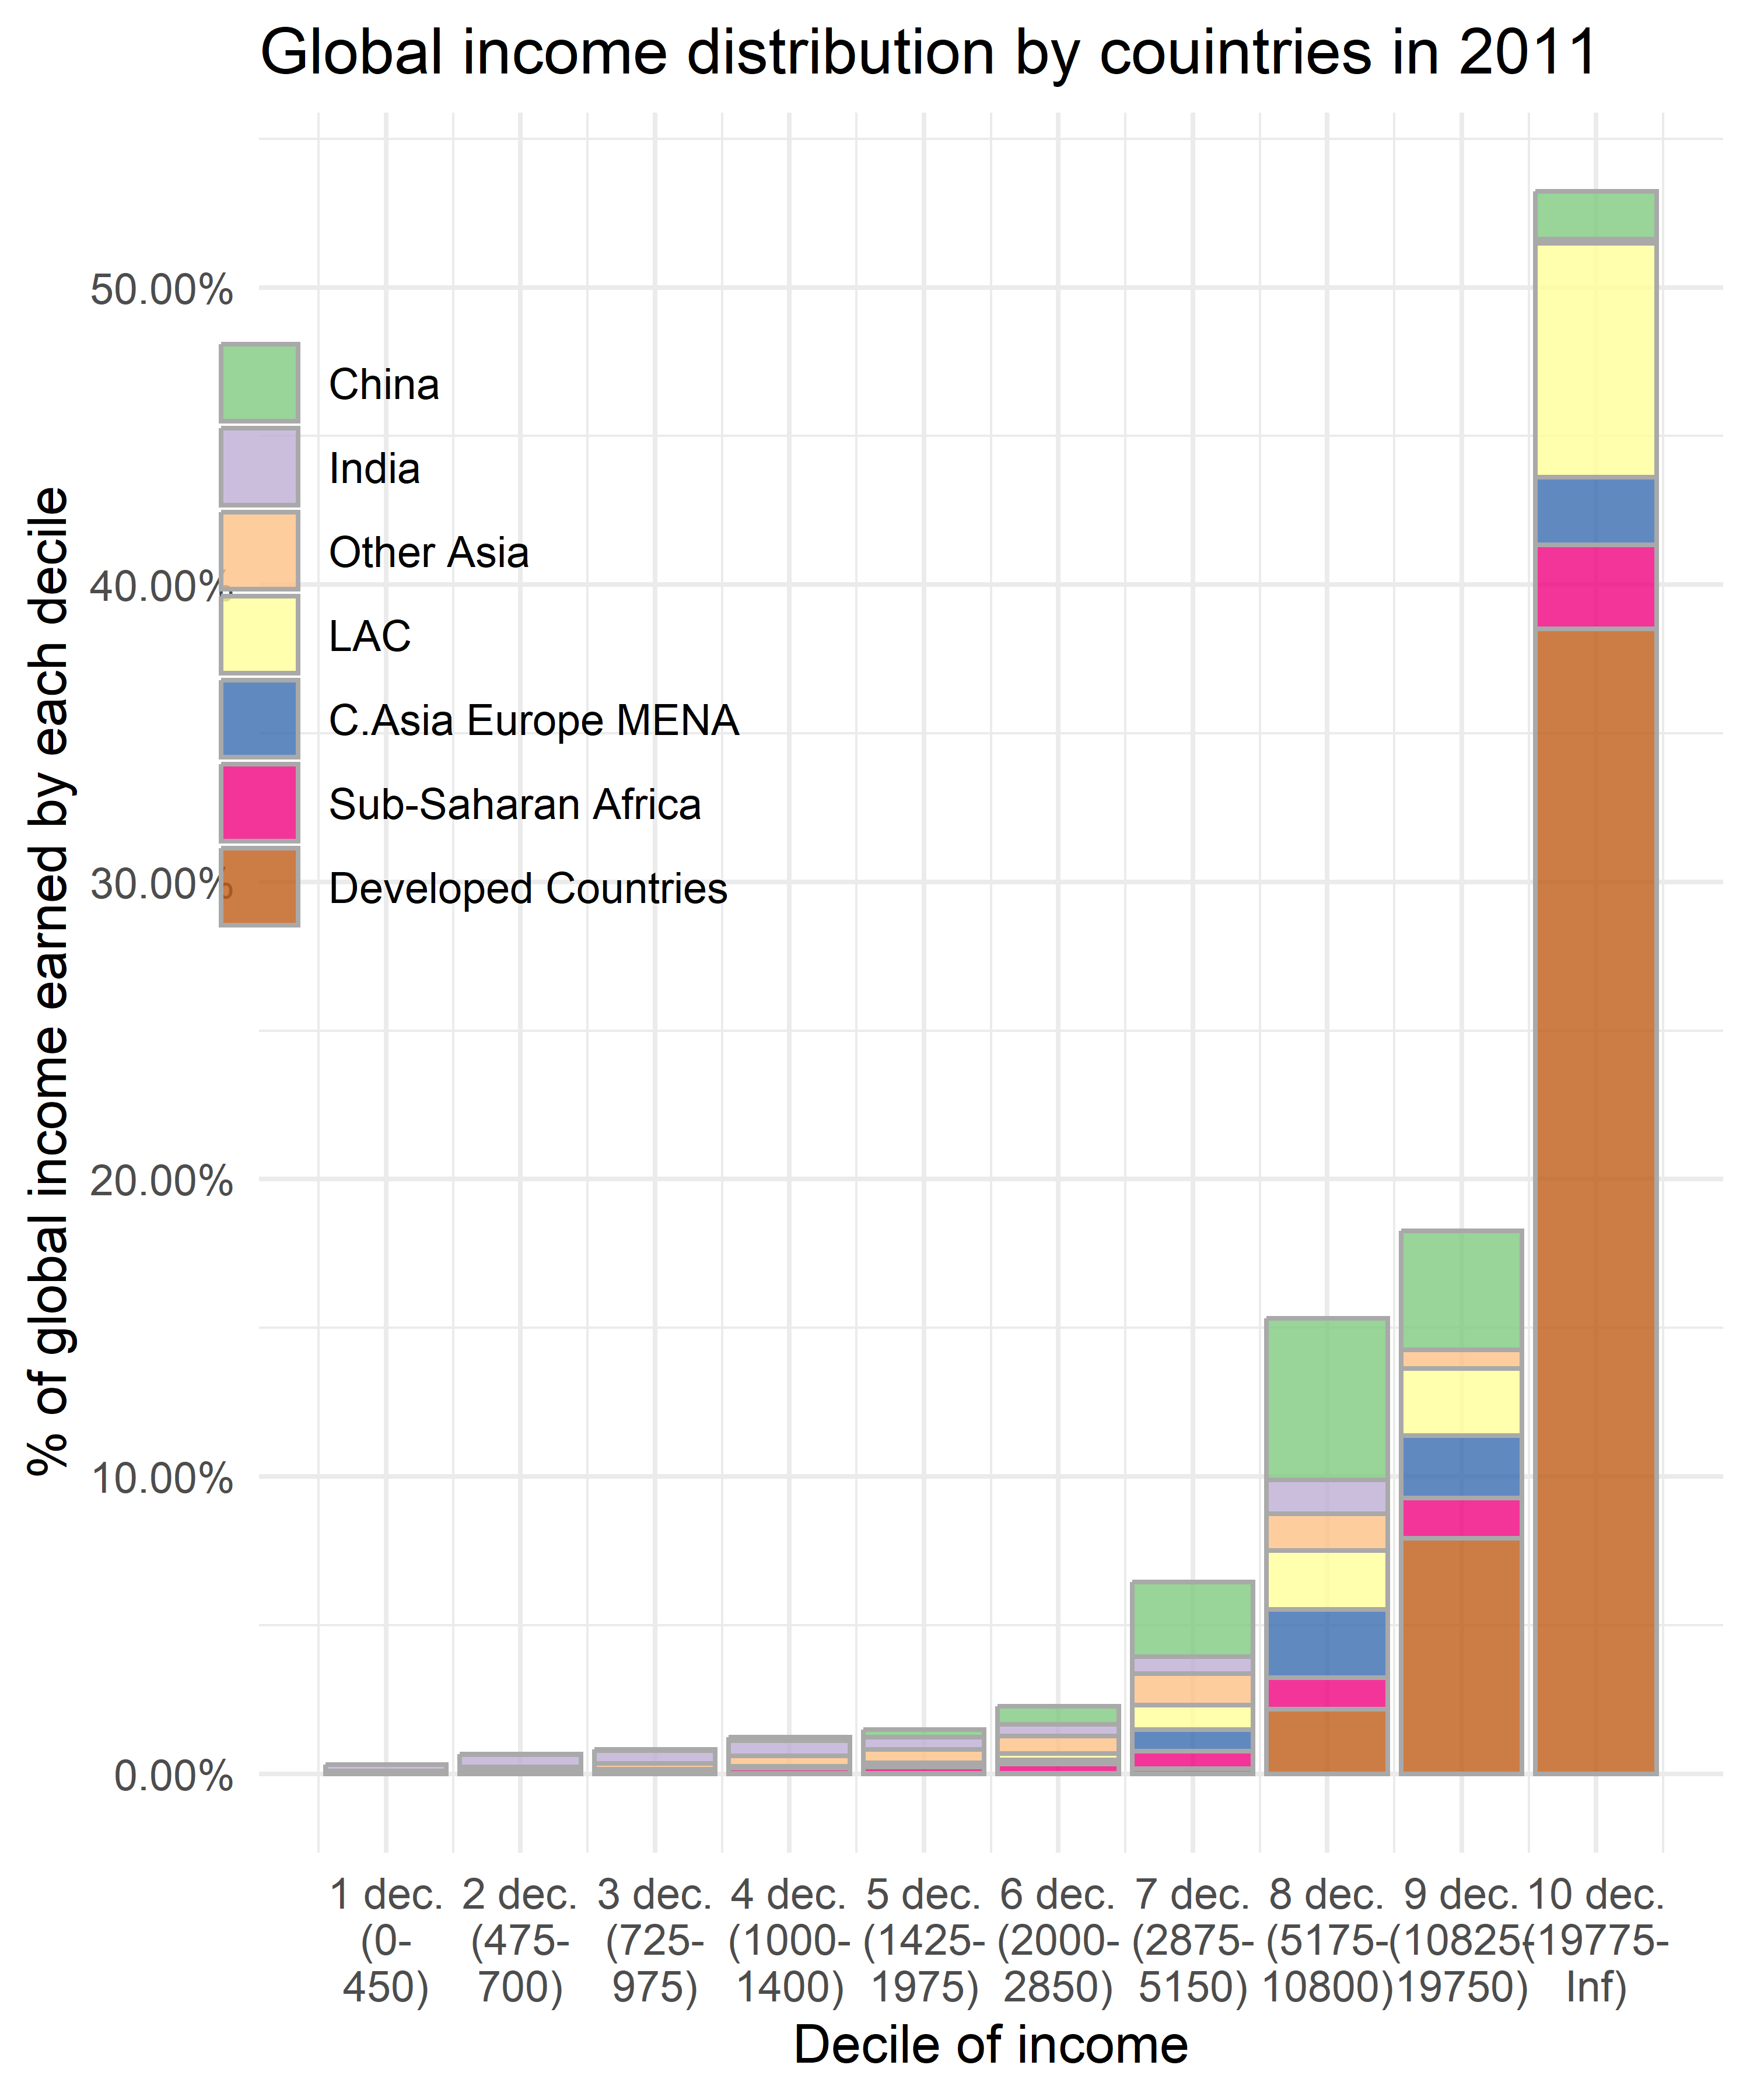
Deciles (7). By country
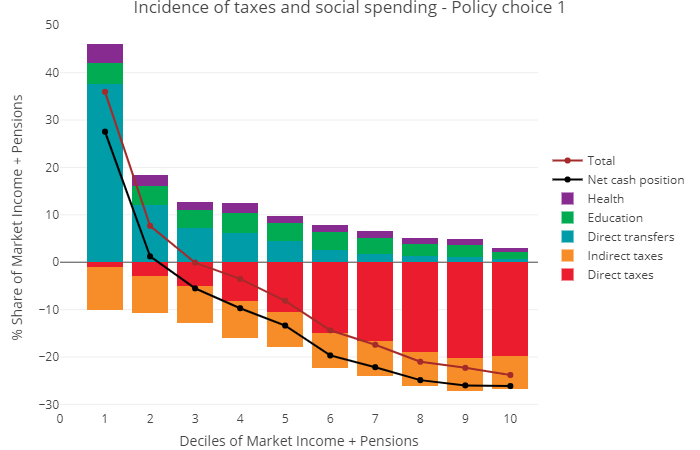
Progressive taxation
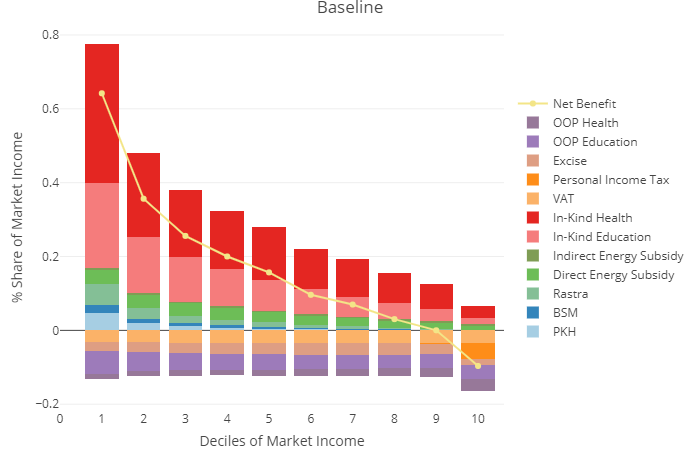
Regressive taxation
Robust vs non robust variance
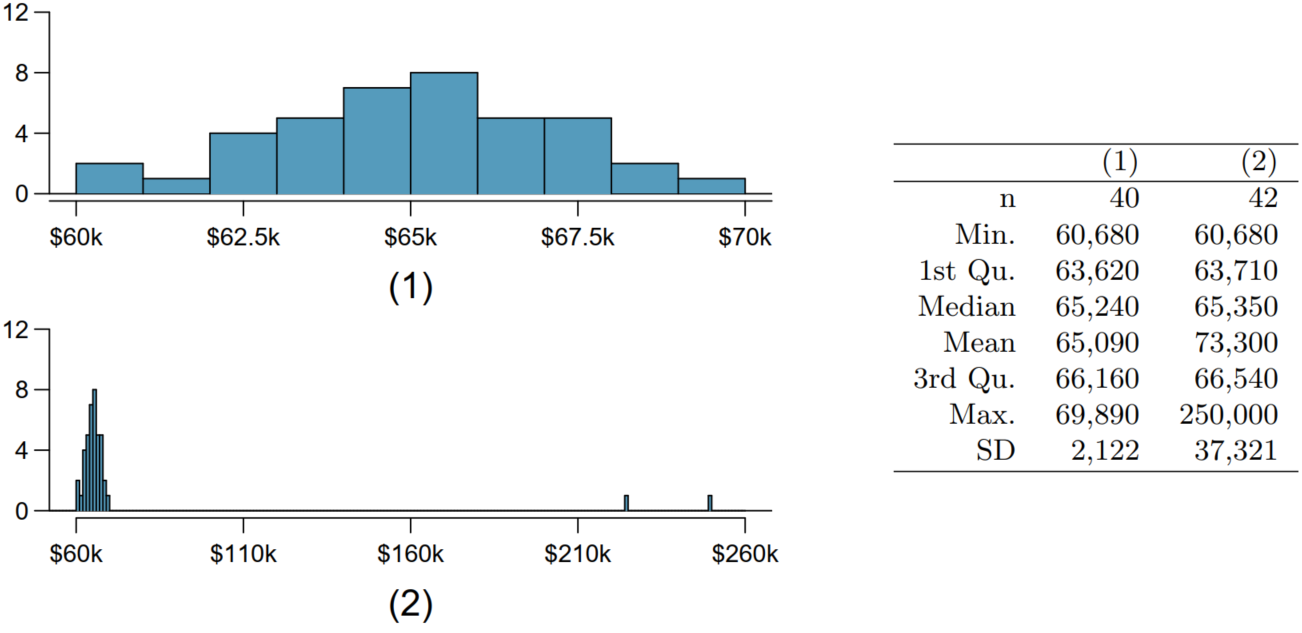
Would the mean or the median best represent the central tendency?
What does this say about the robustness of the two measures?
Would the standard deviation or the IQR best represent the amount of variability in the incomes?
At home: Match distribution with the box plot
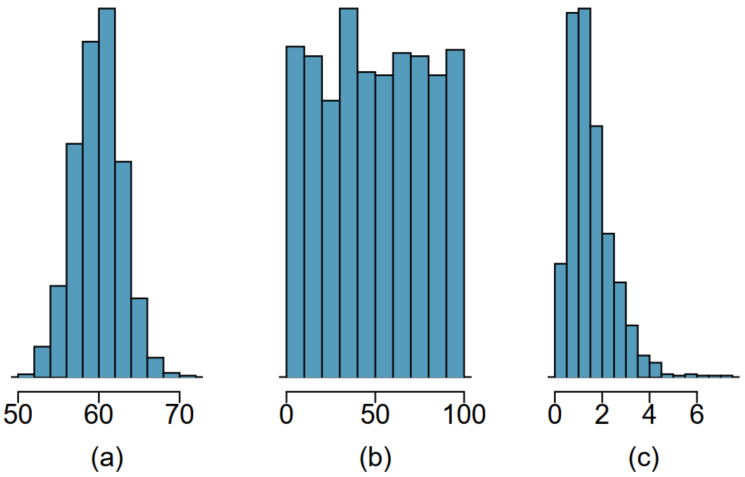
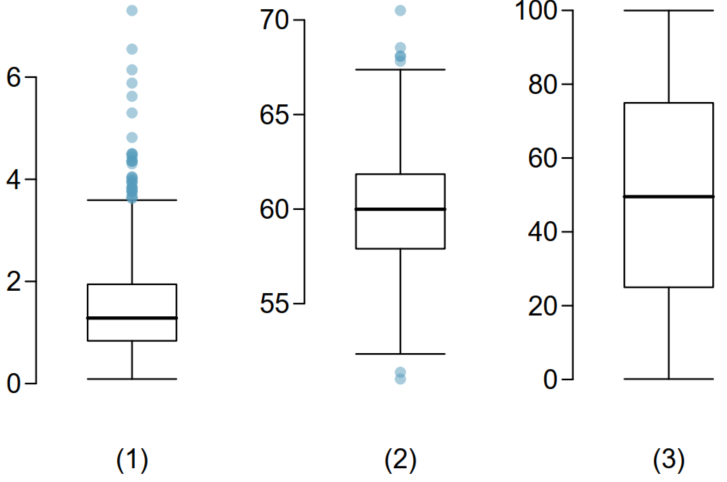
- Describe the distribution in the histograms below and match them to the box plots.
Diez, David, Mine Cetinkaya-Rundel, and Christopher D Barr. 2022. OpenIntro Statistics: Fourth Edition. OpenIntro. https://www.openintro.org/book/os/.