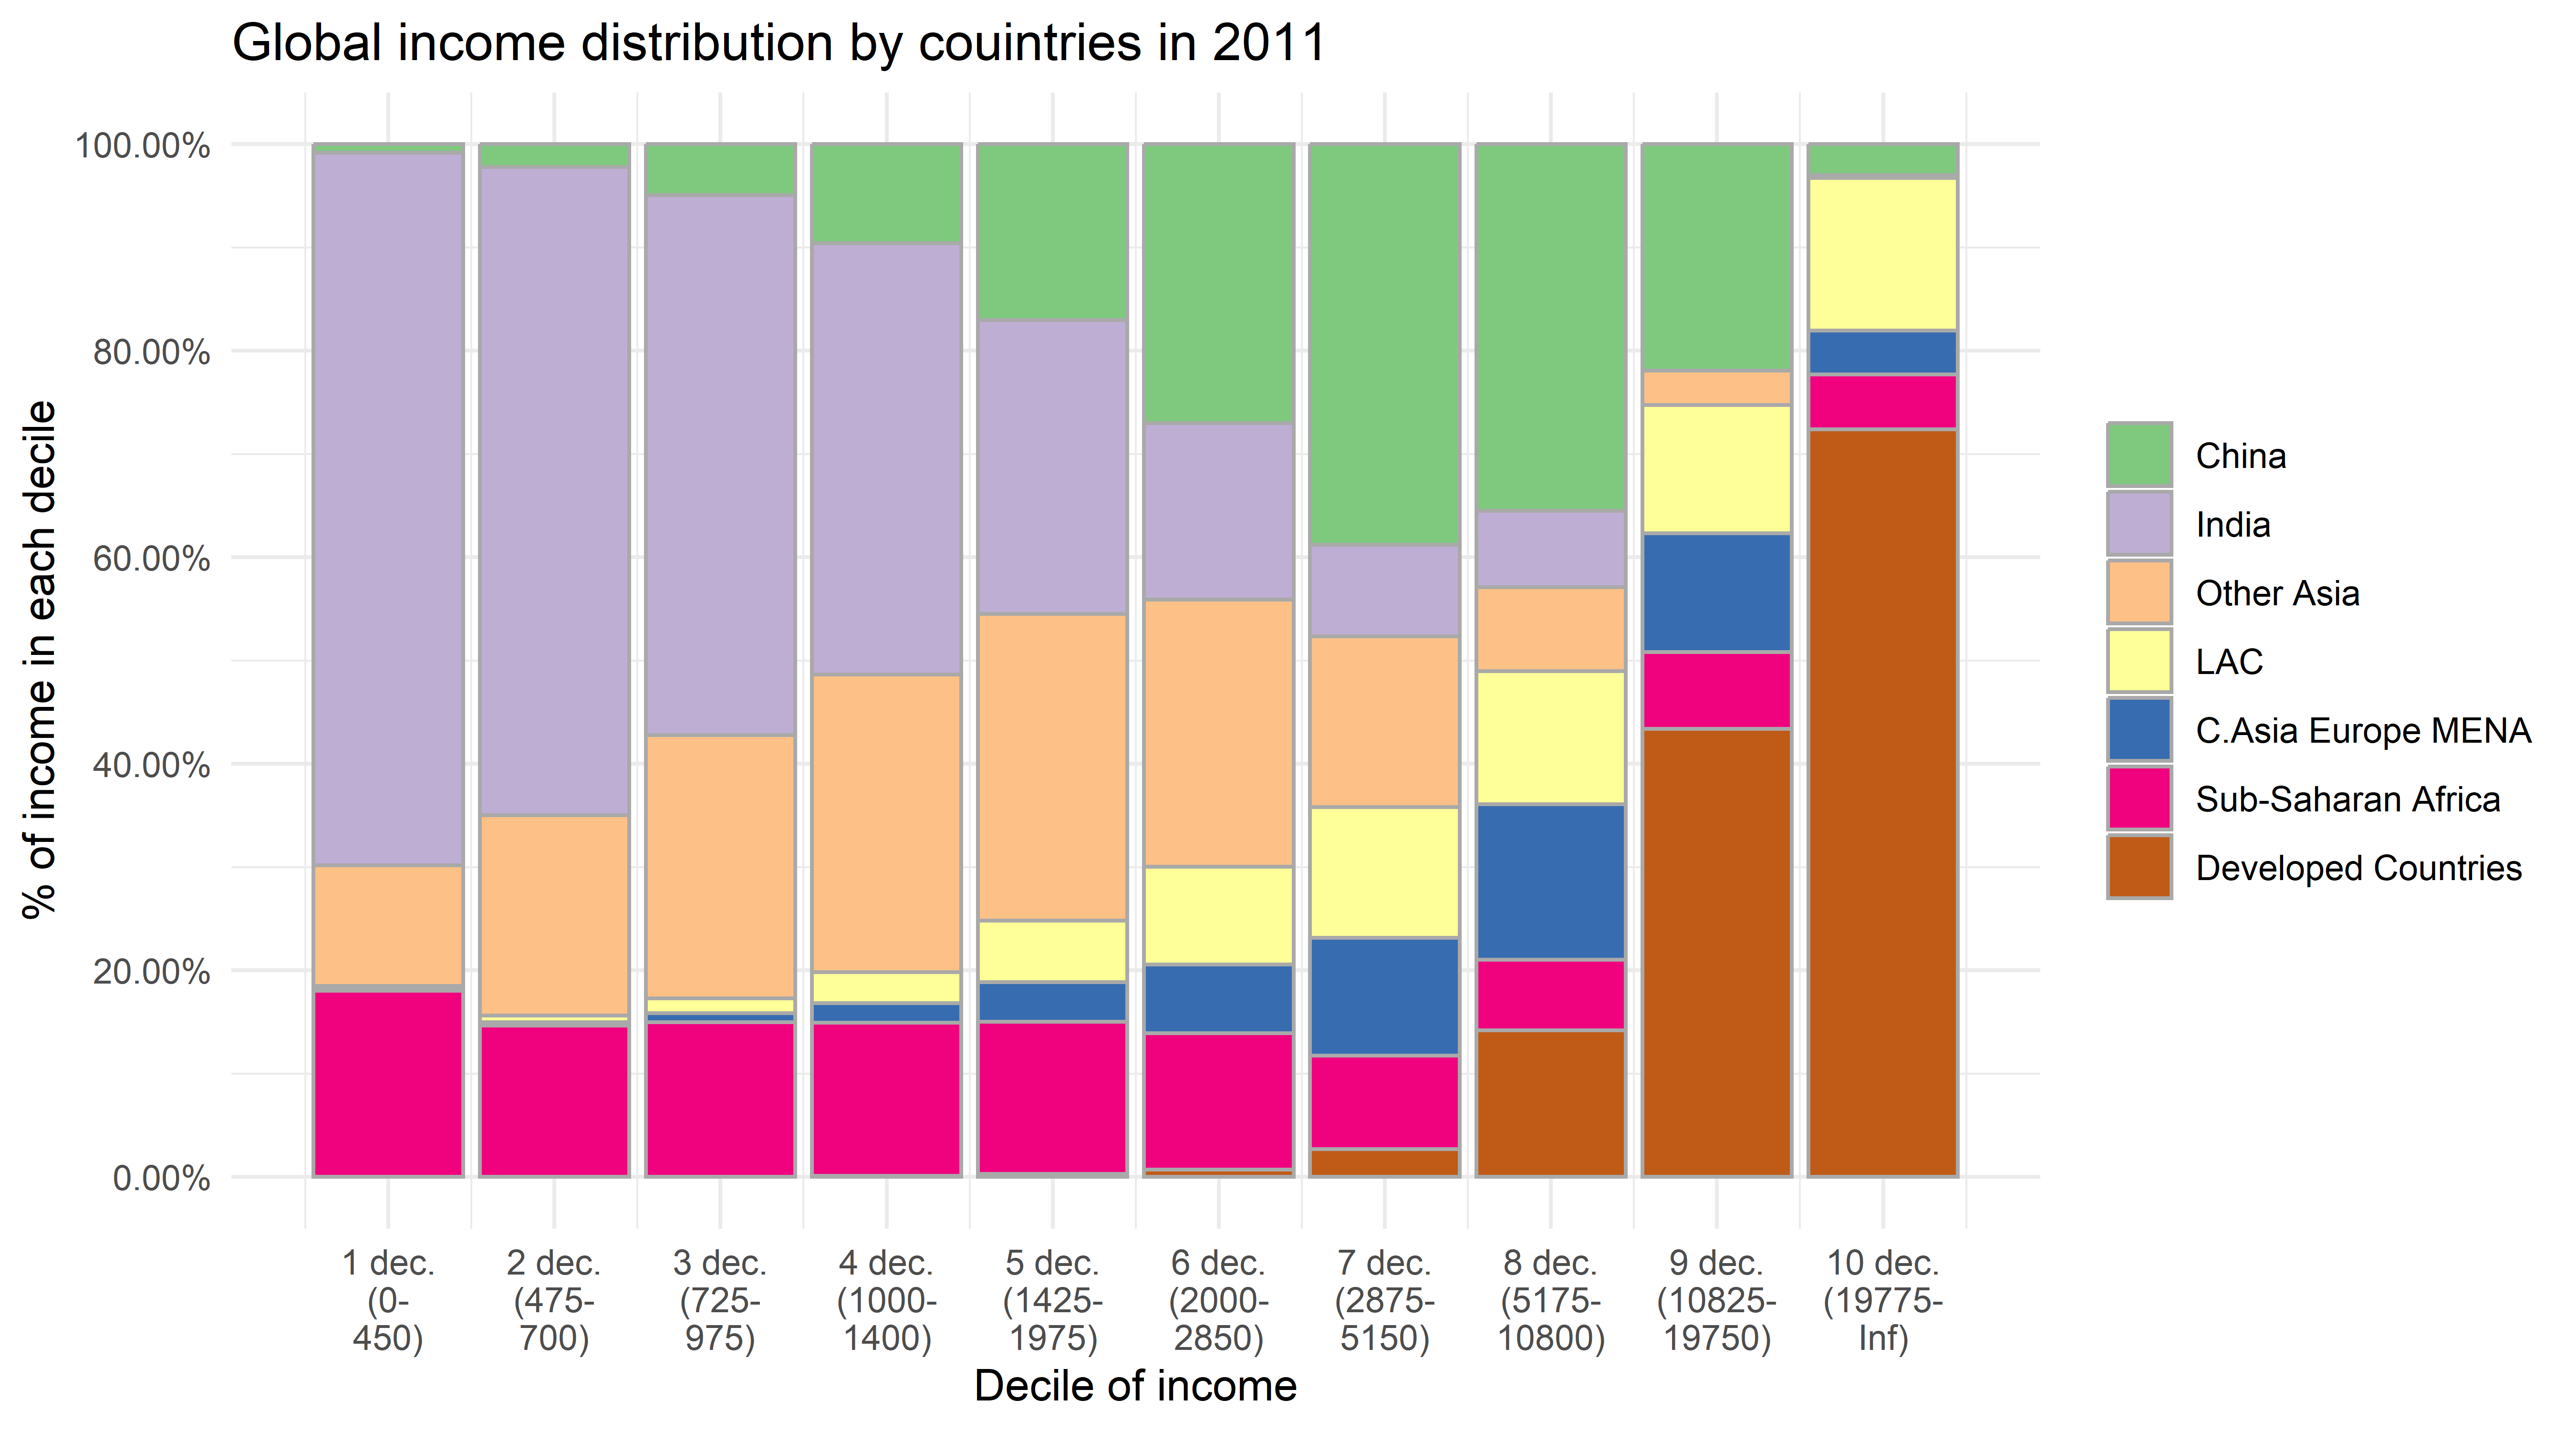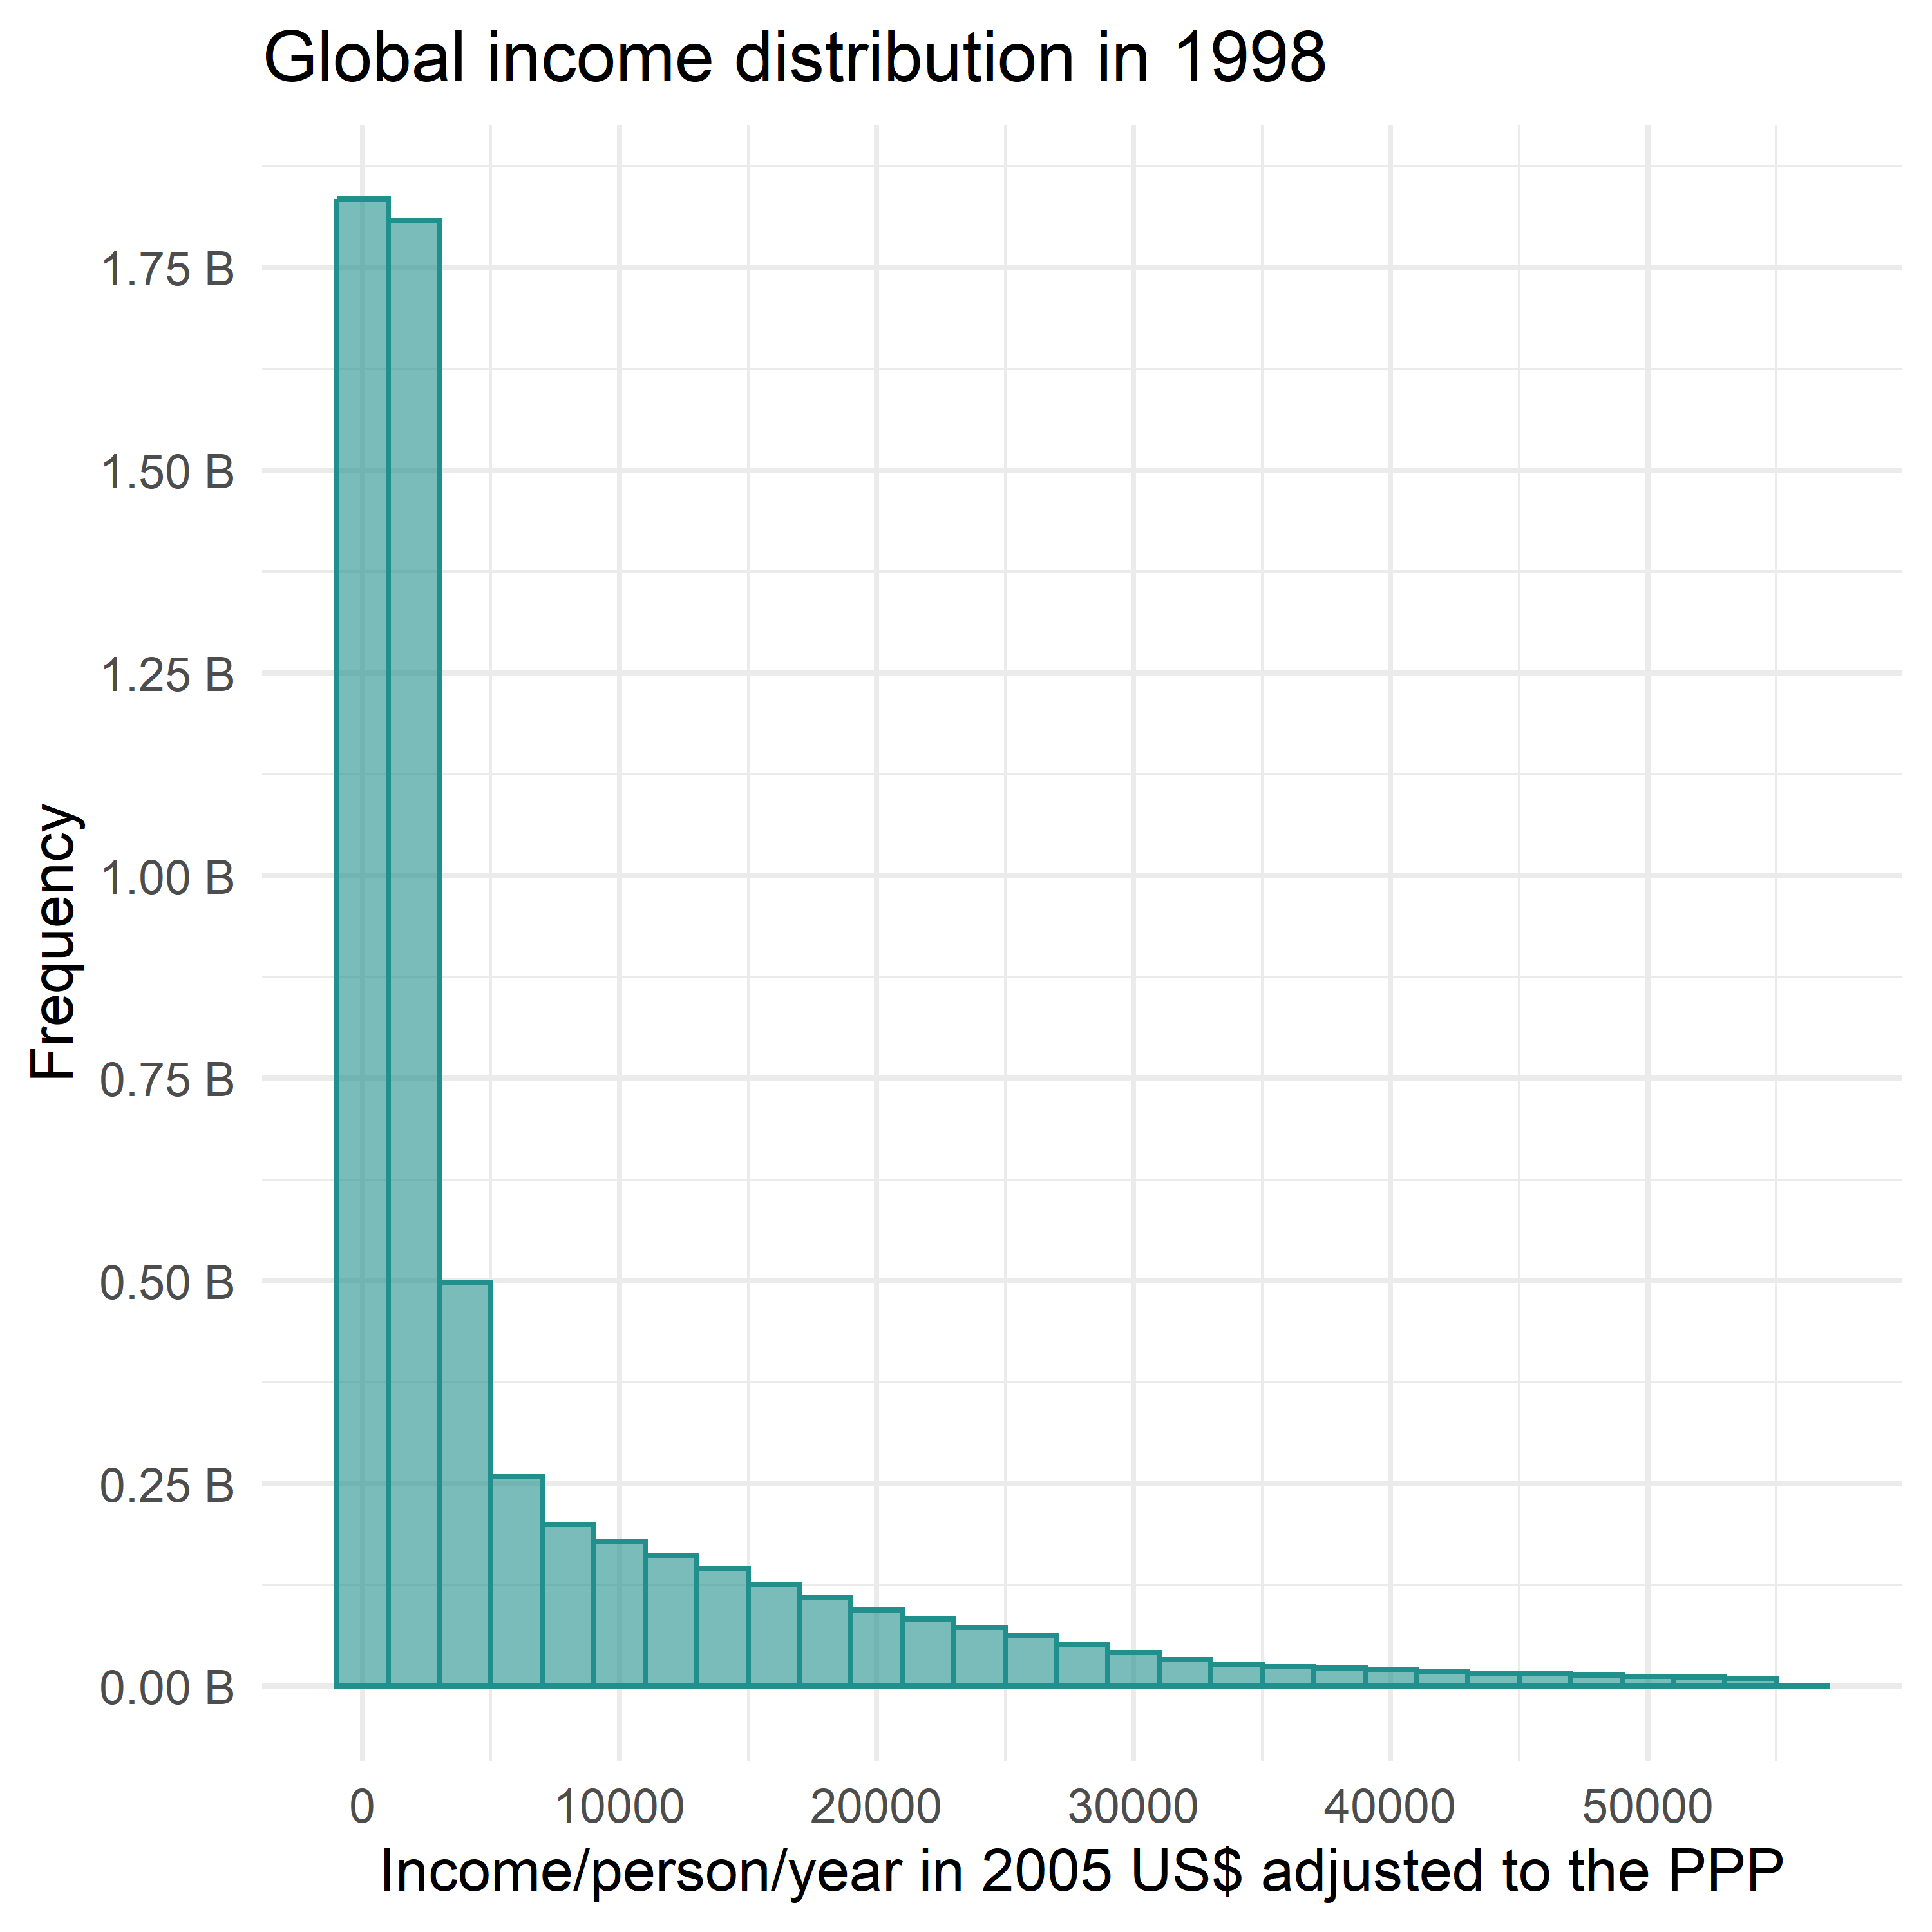
Deciles (1) of Income Distribution
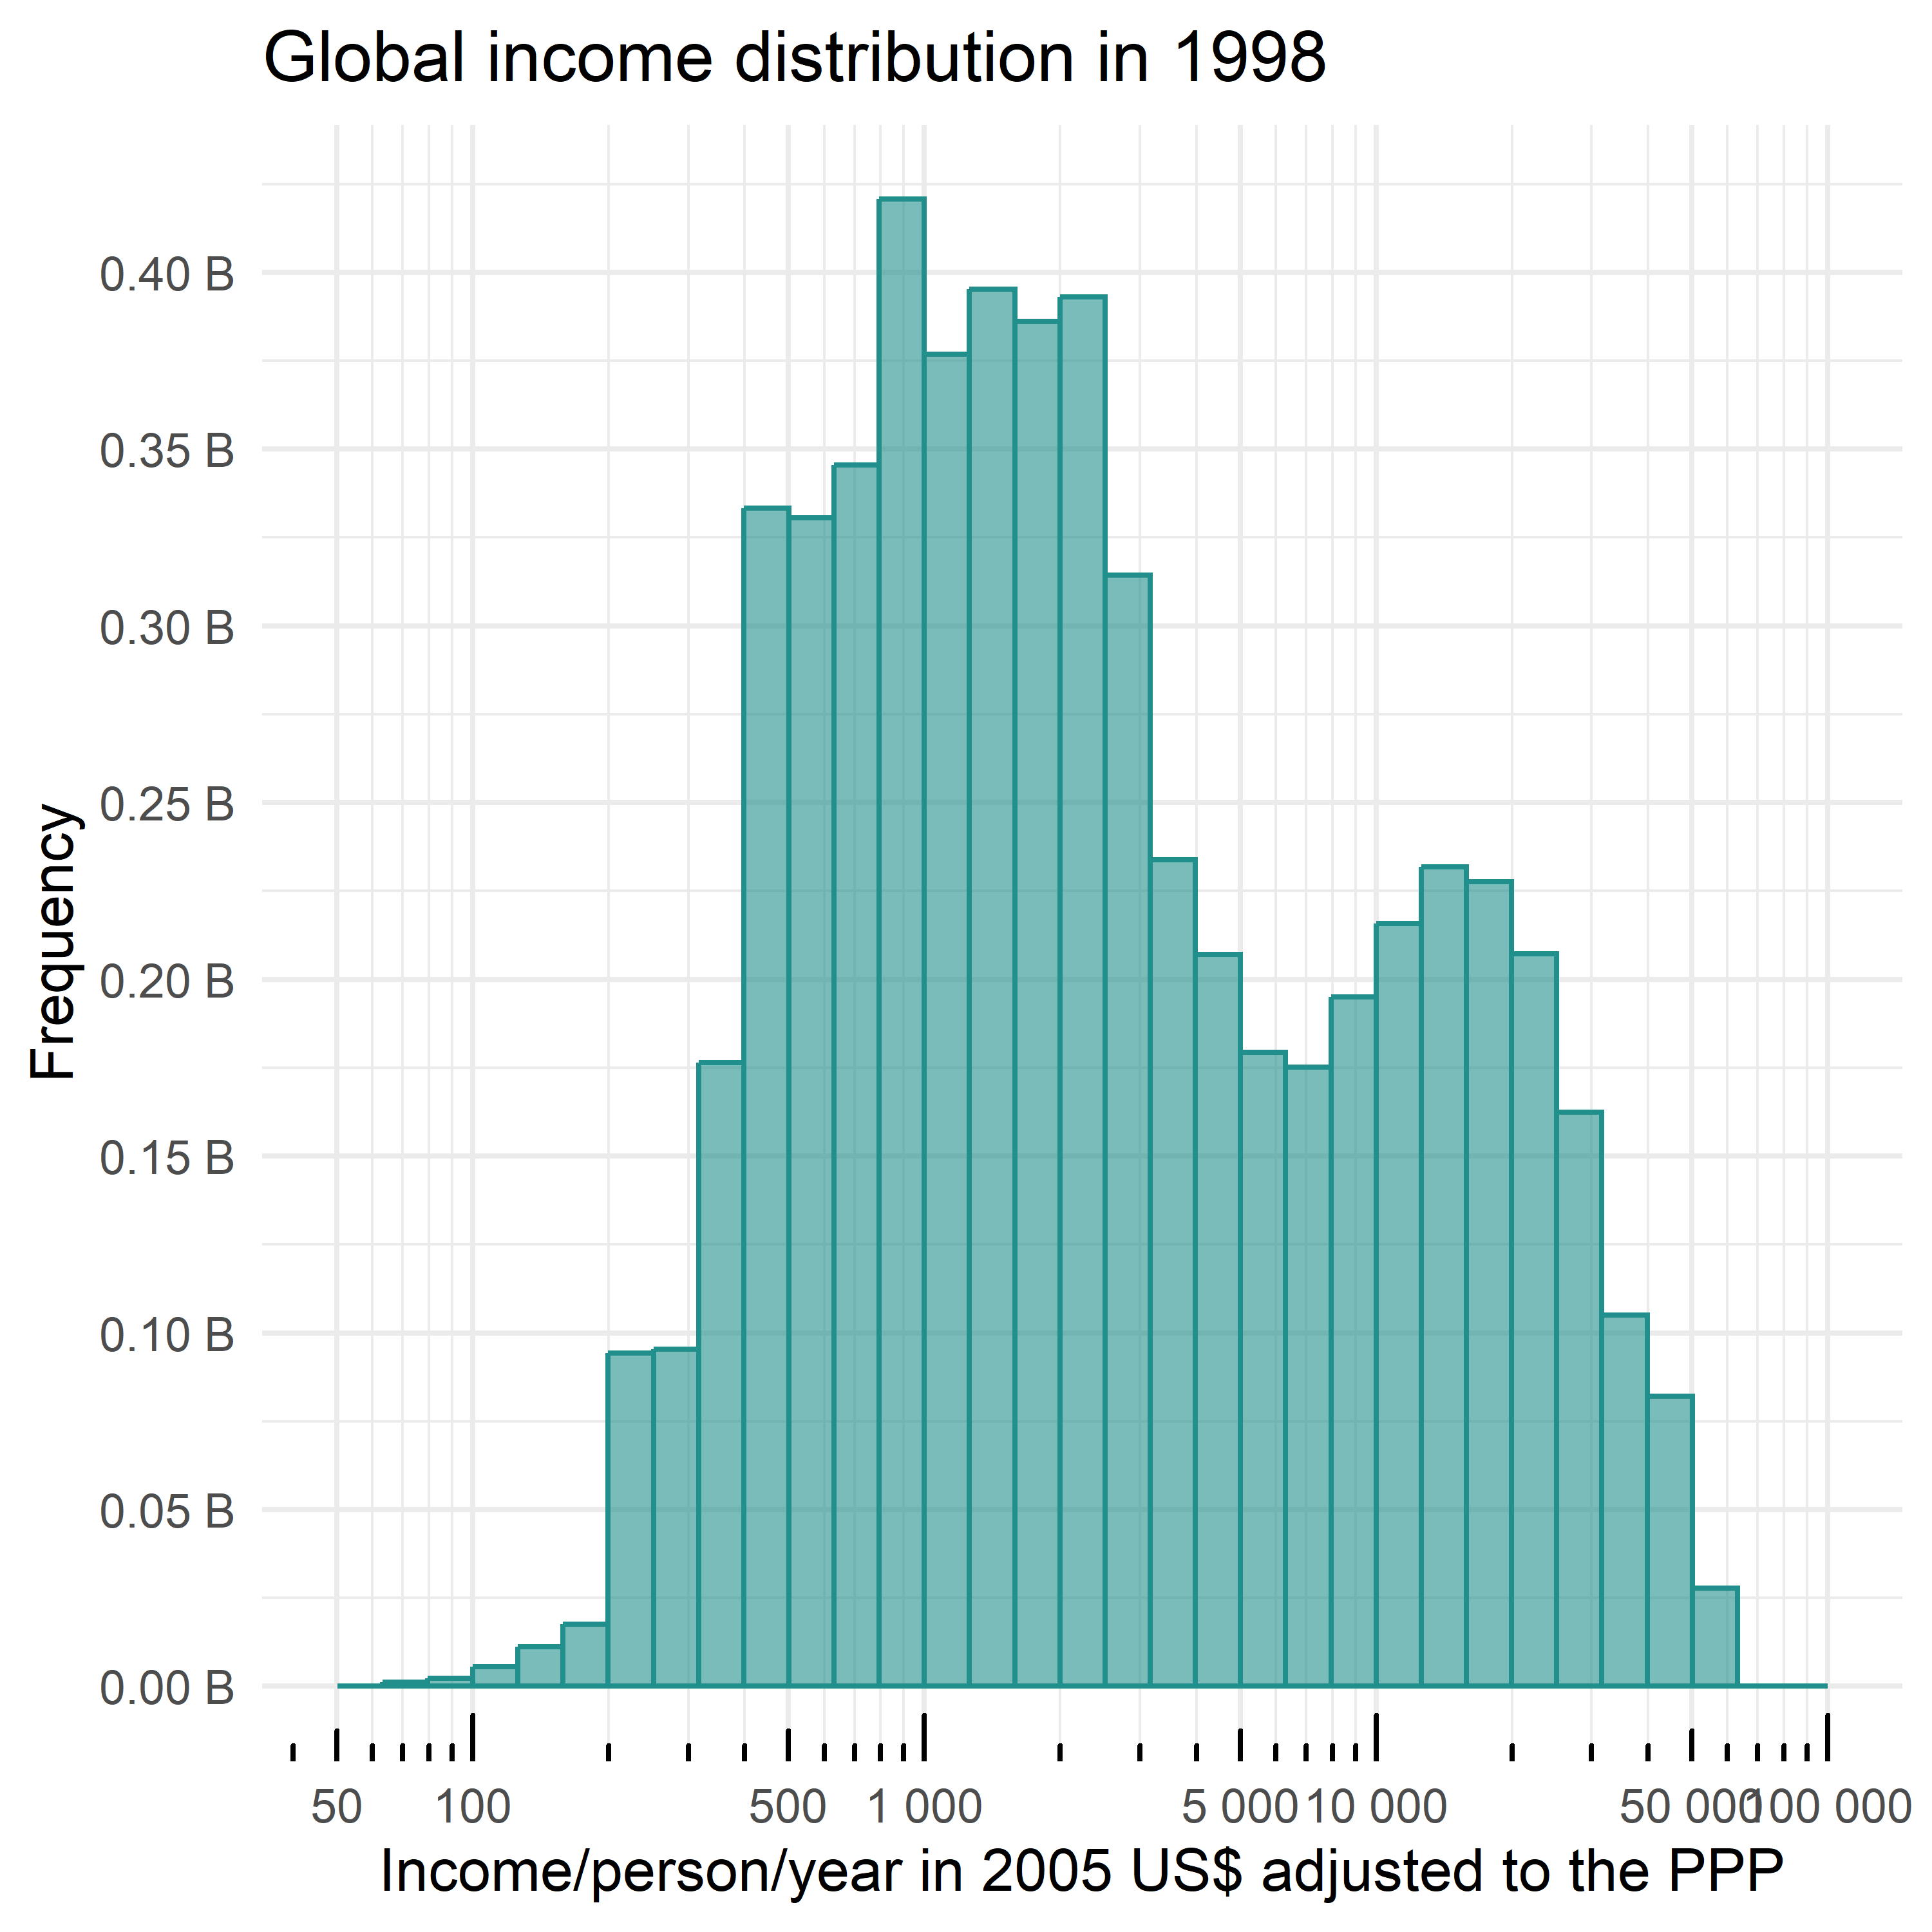
Deciles (2) of Income Distribution
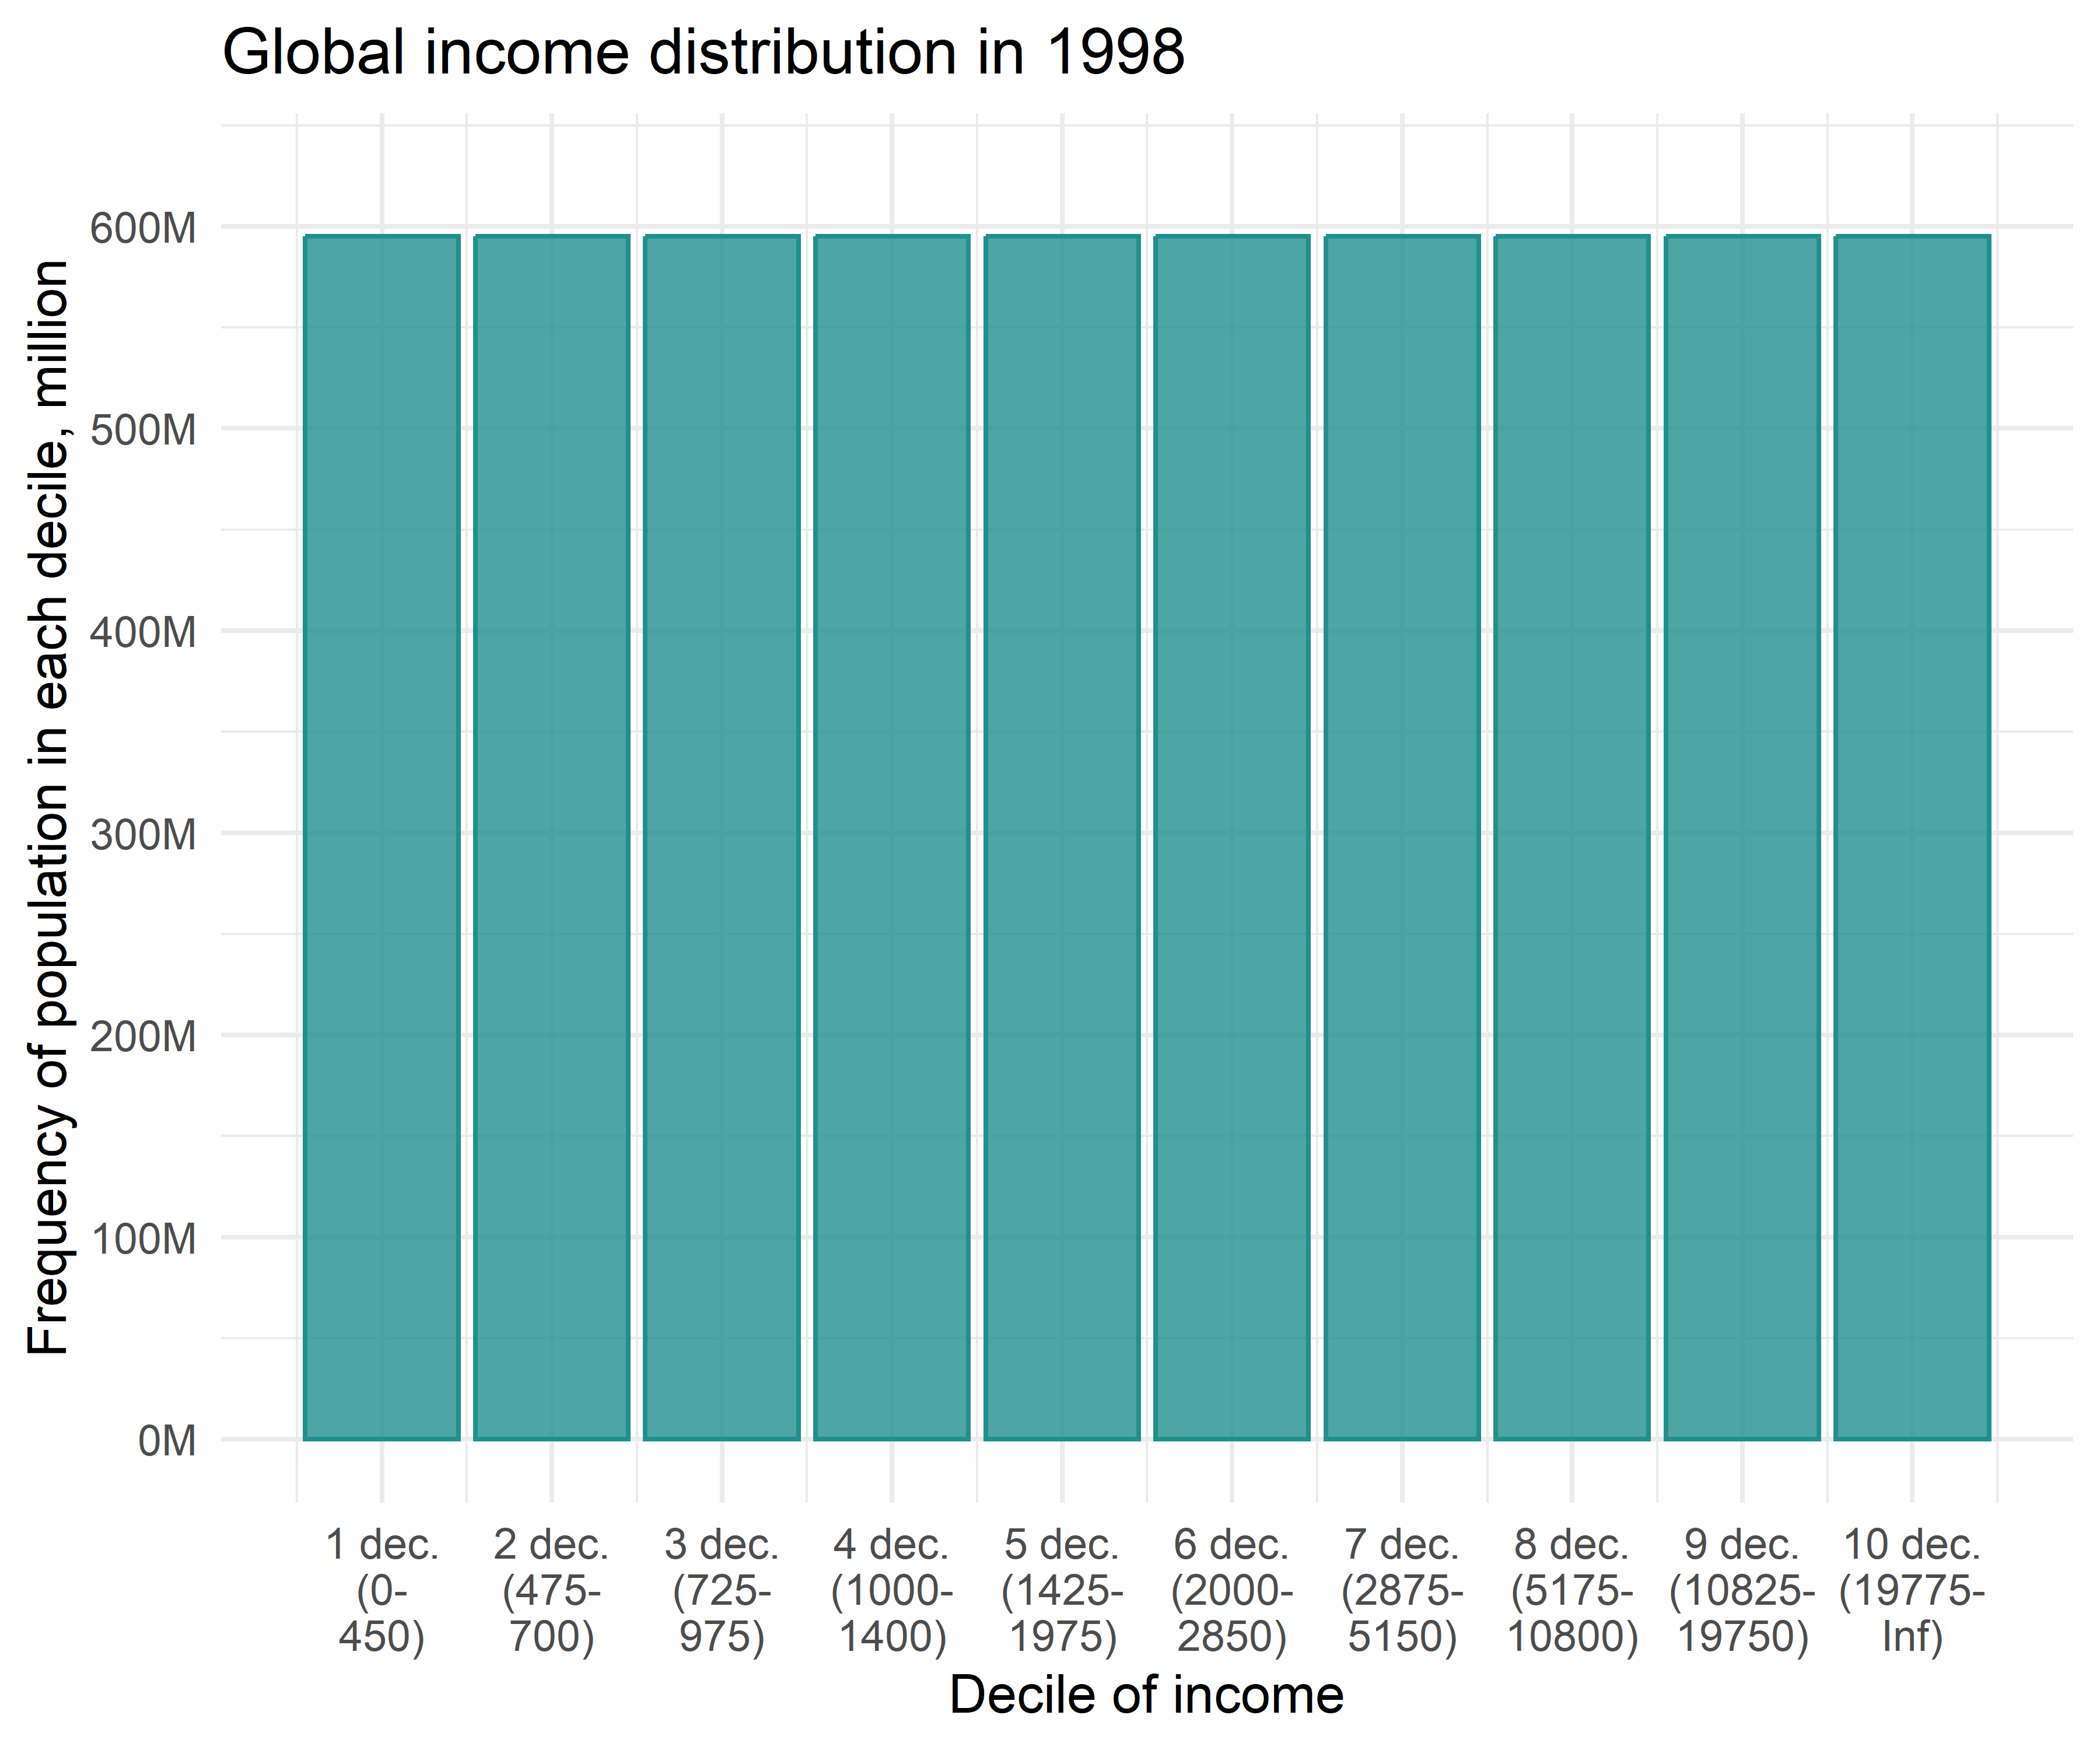
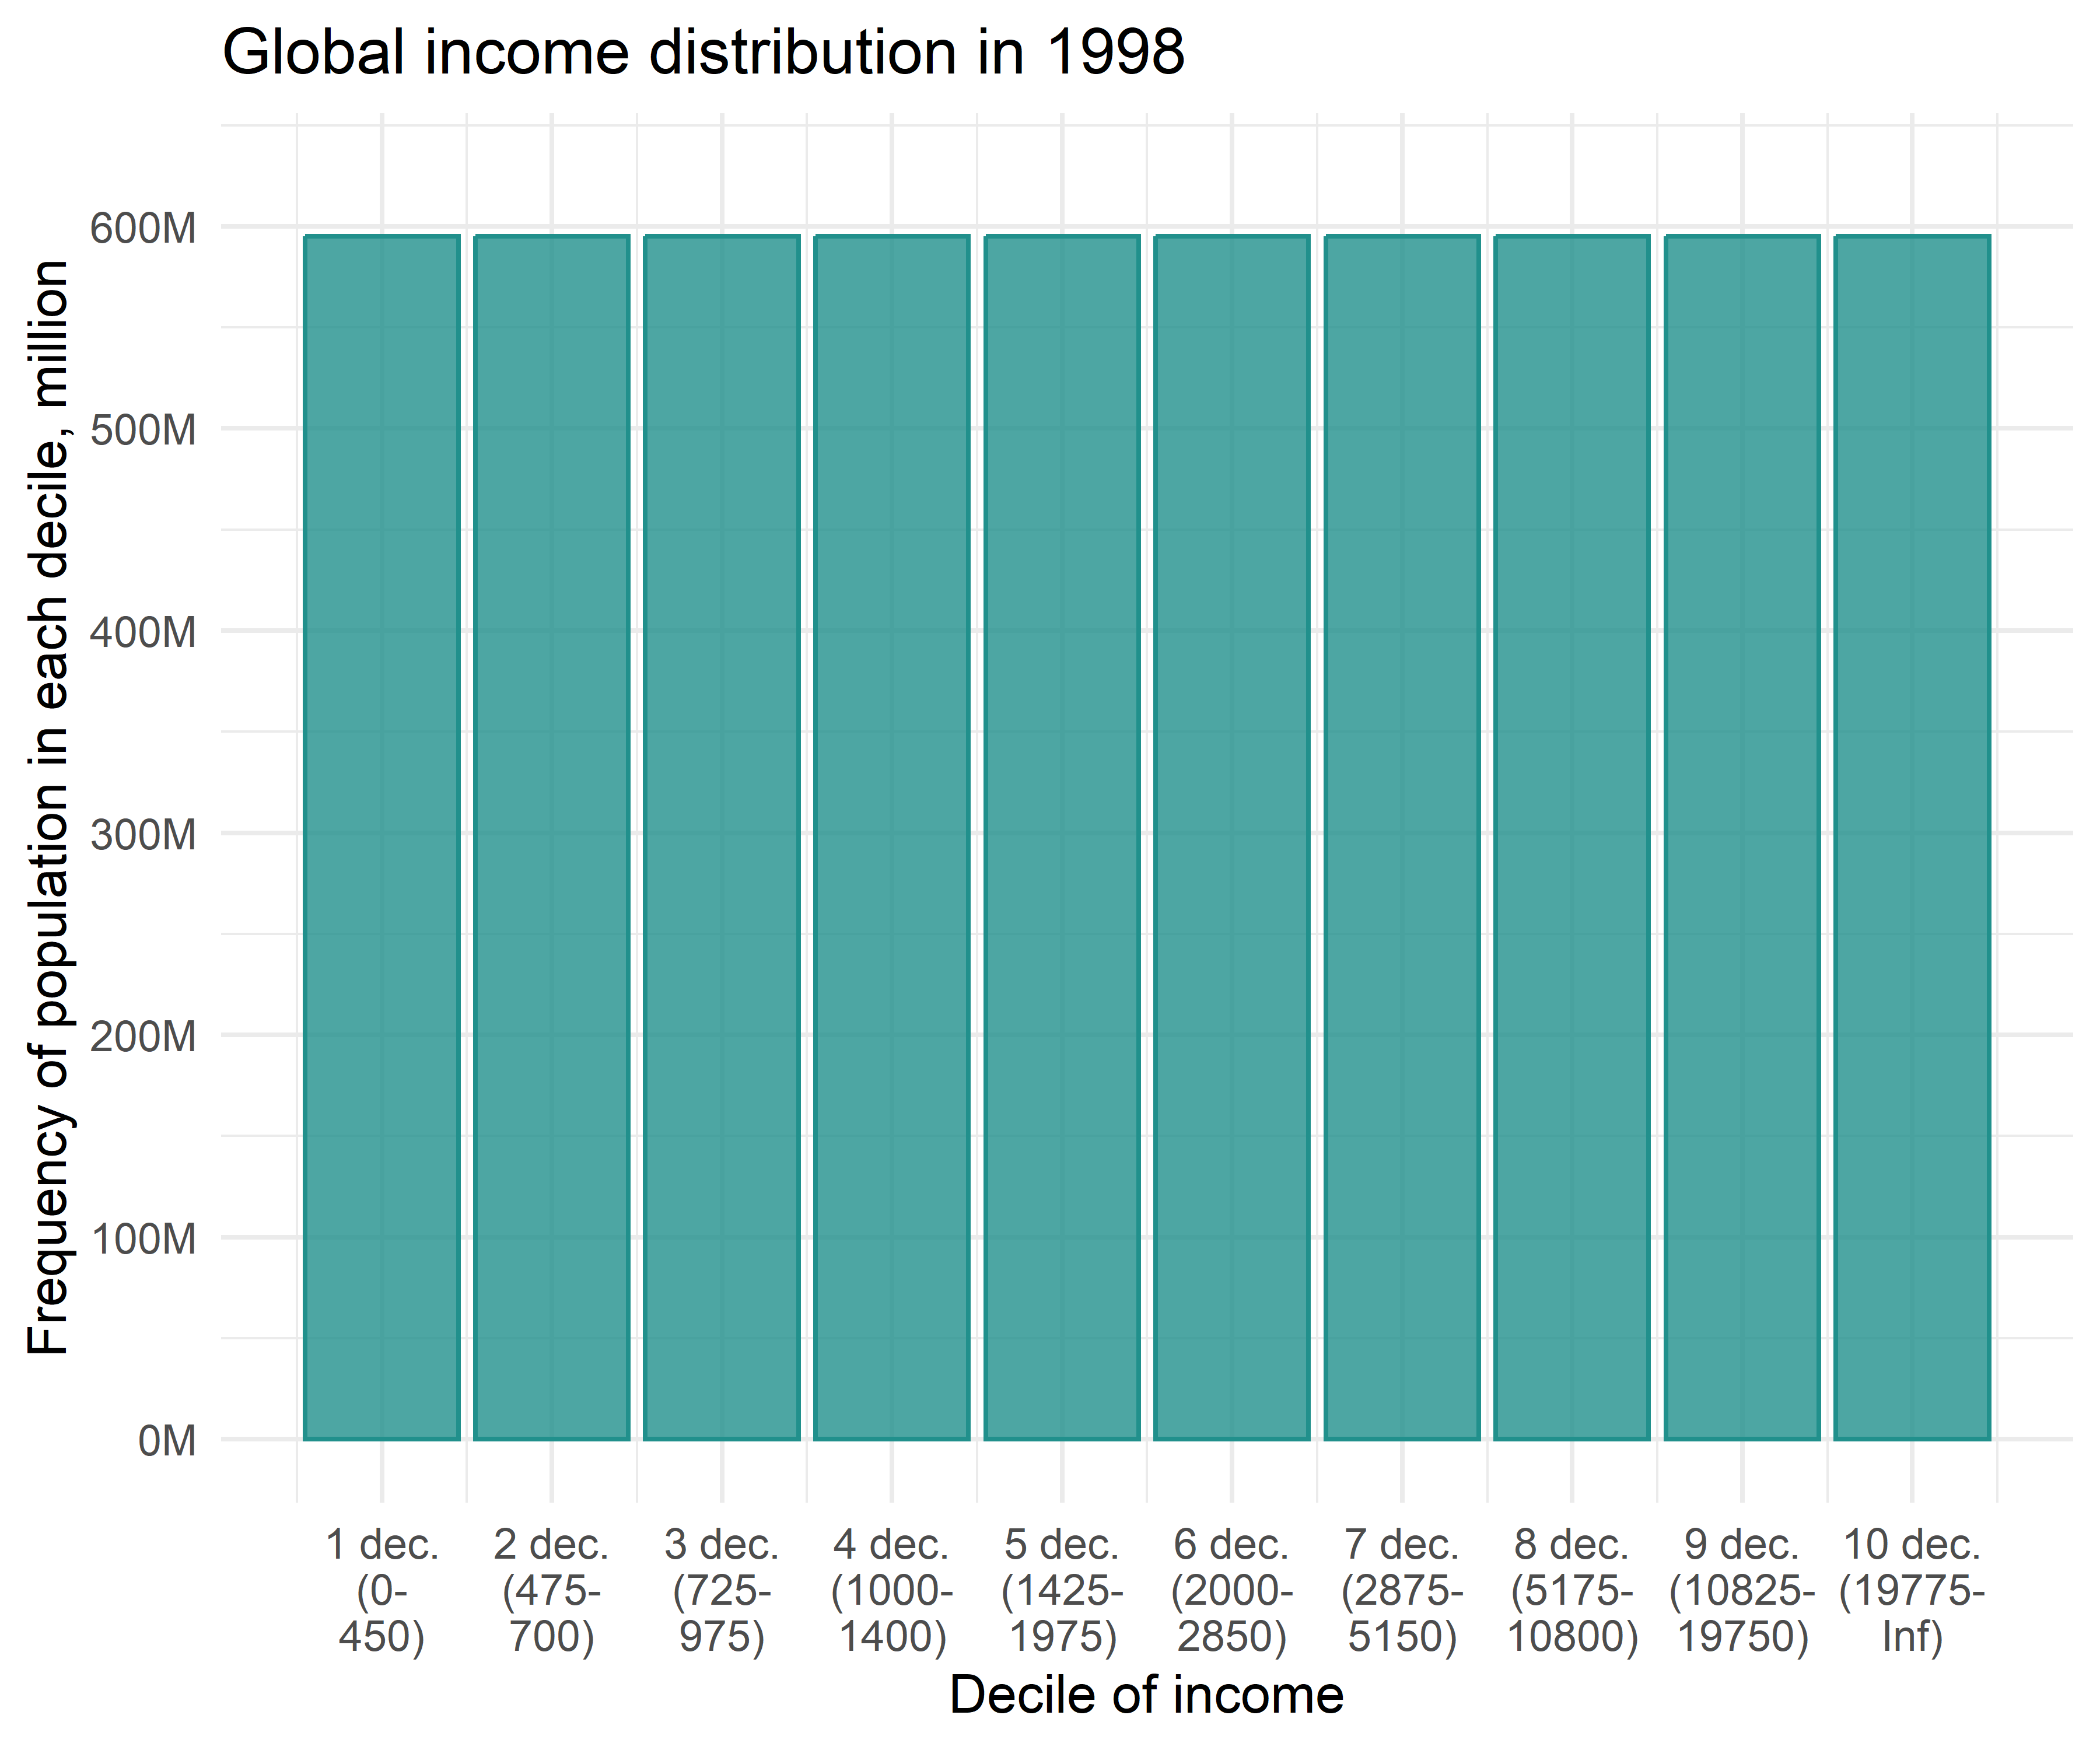
Let us draw a histogram with frequency by deciles!
- Note: the total population in 1998 was 6 billion
- Is it useful?
Deciles (3). New insights
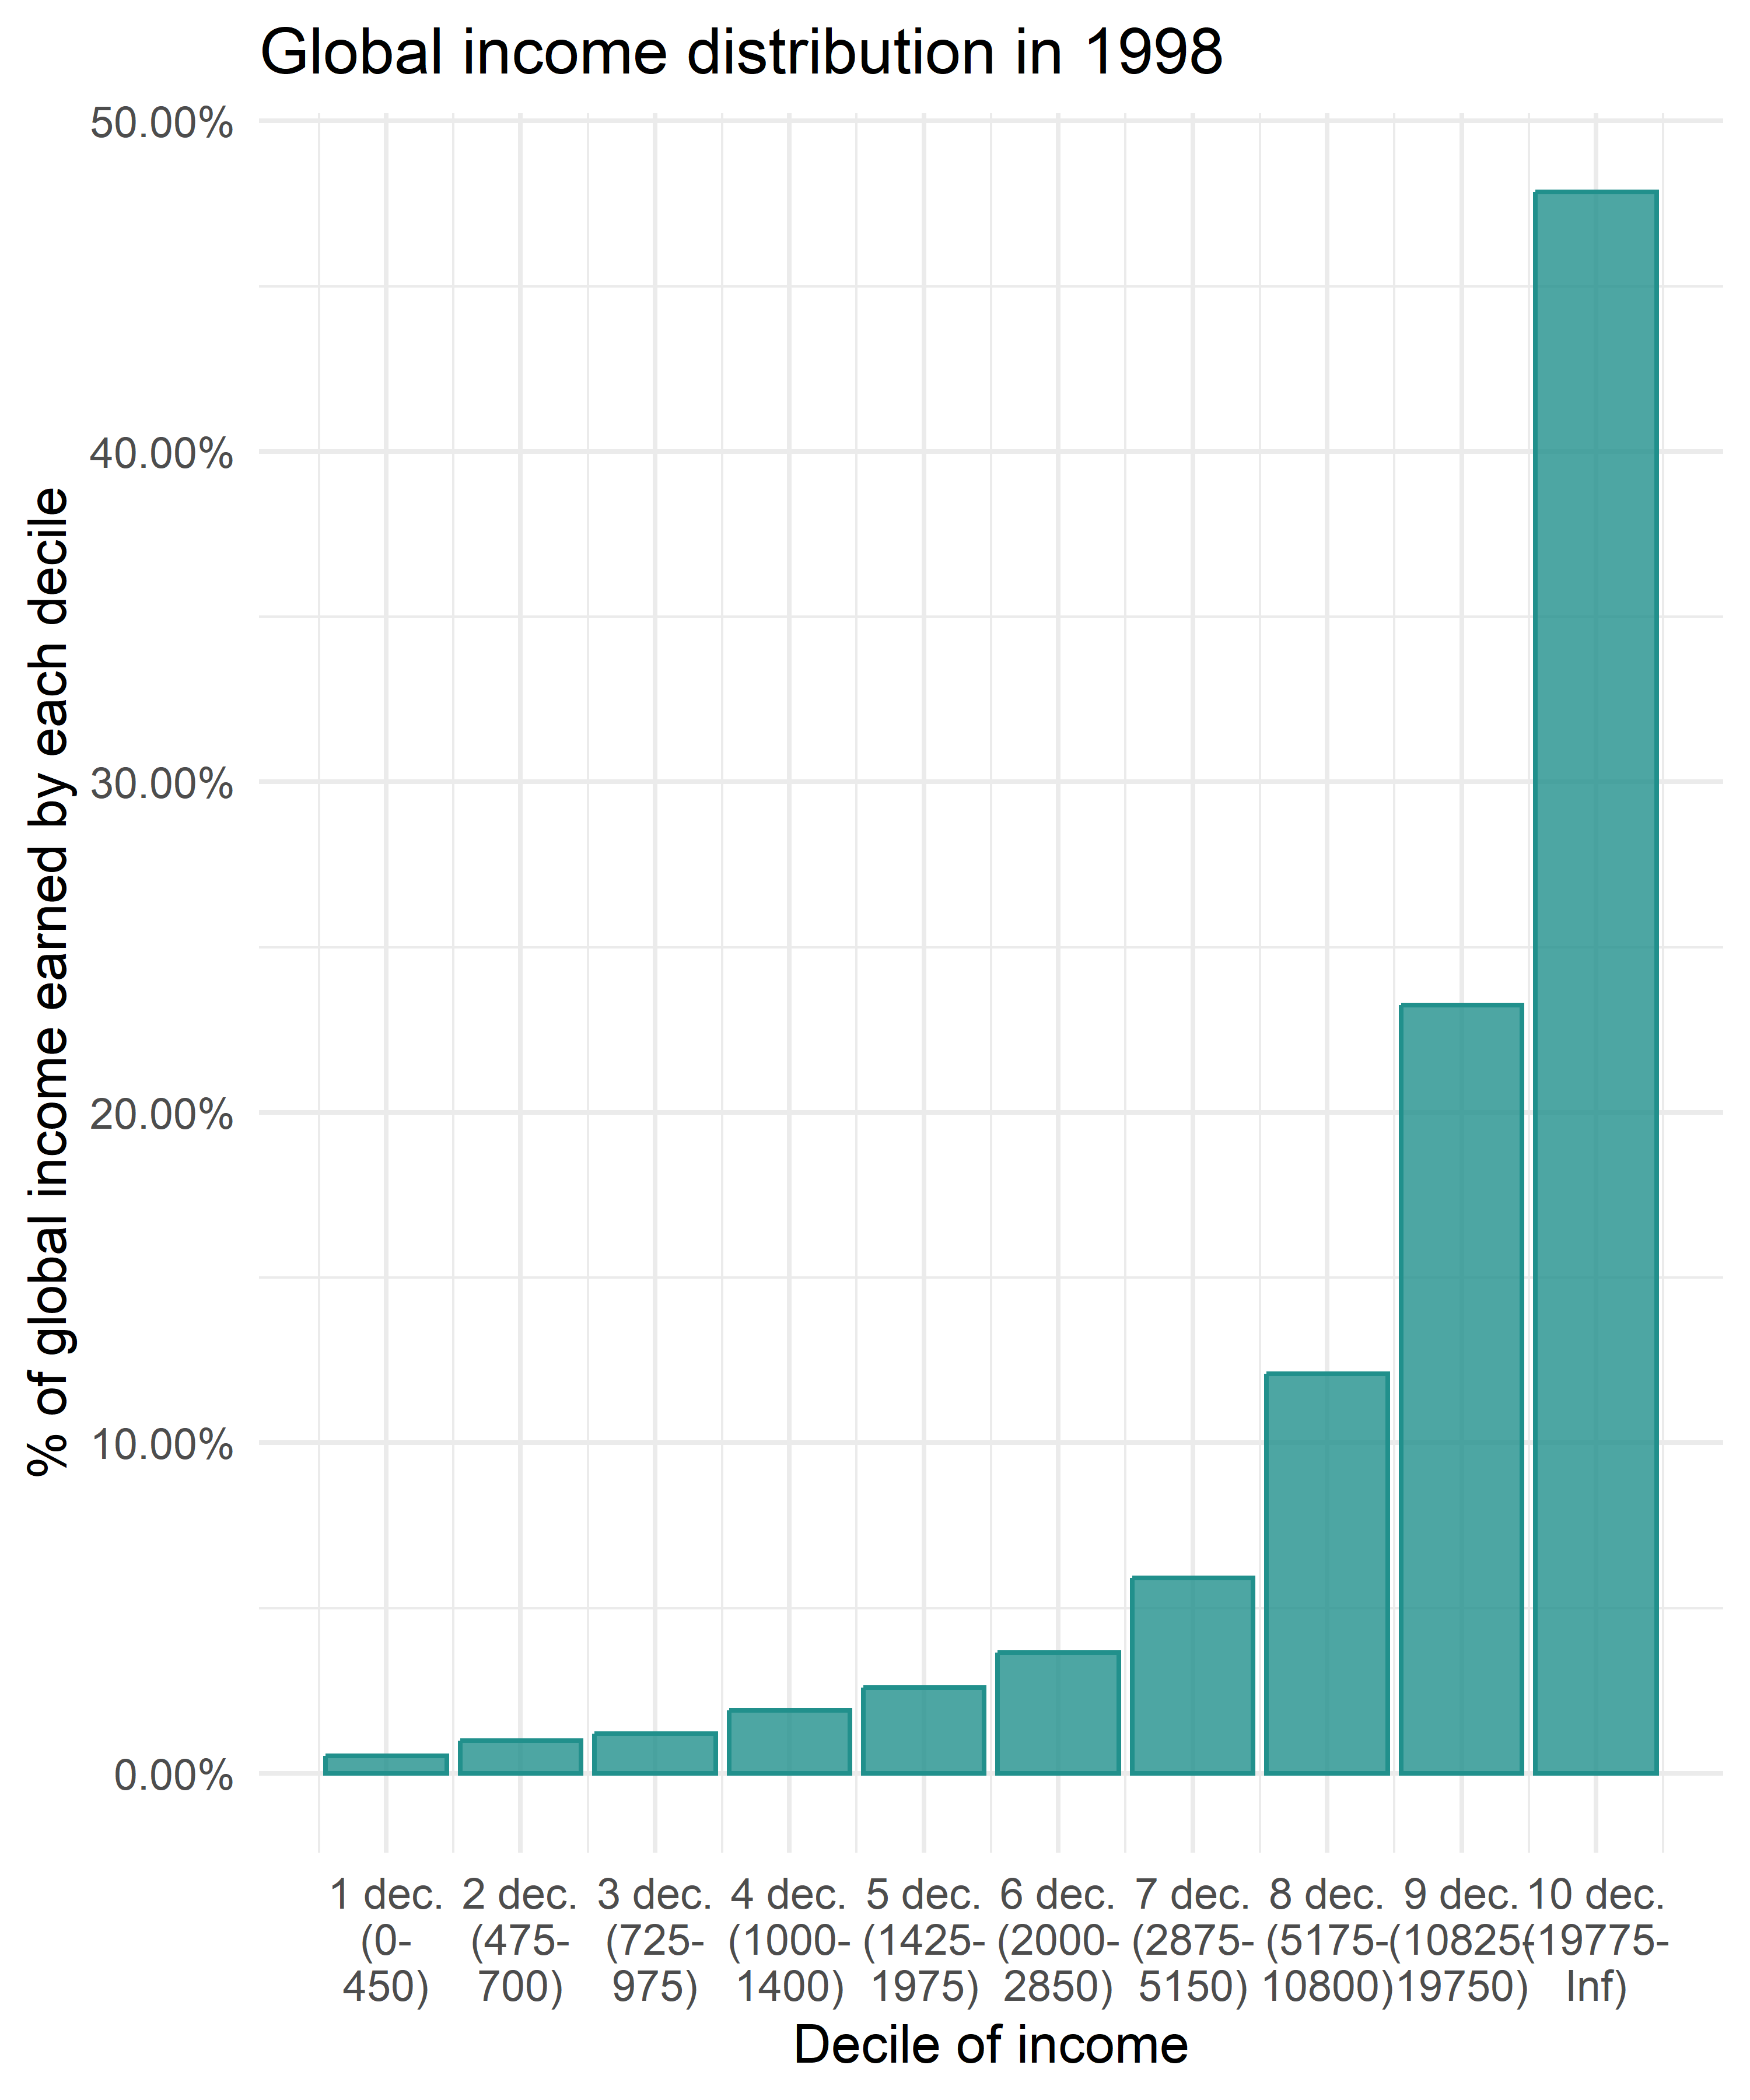
Let us plot % share of total income on Y axis.
Deciles (4). New insights
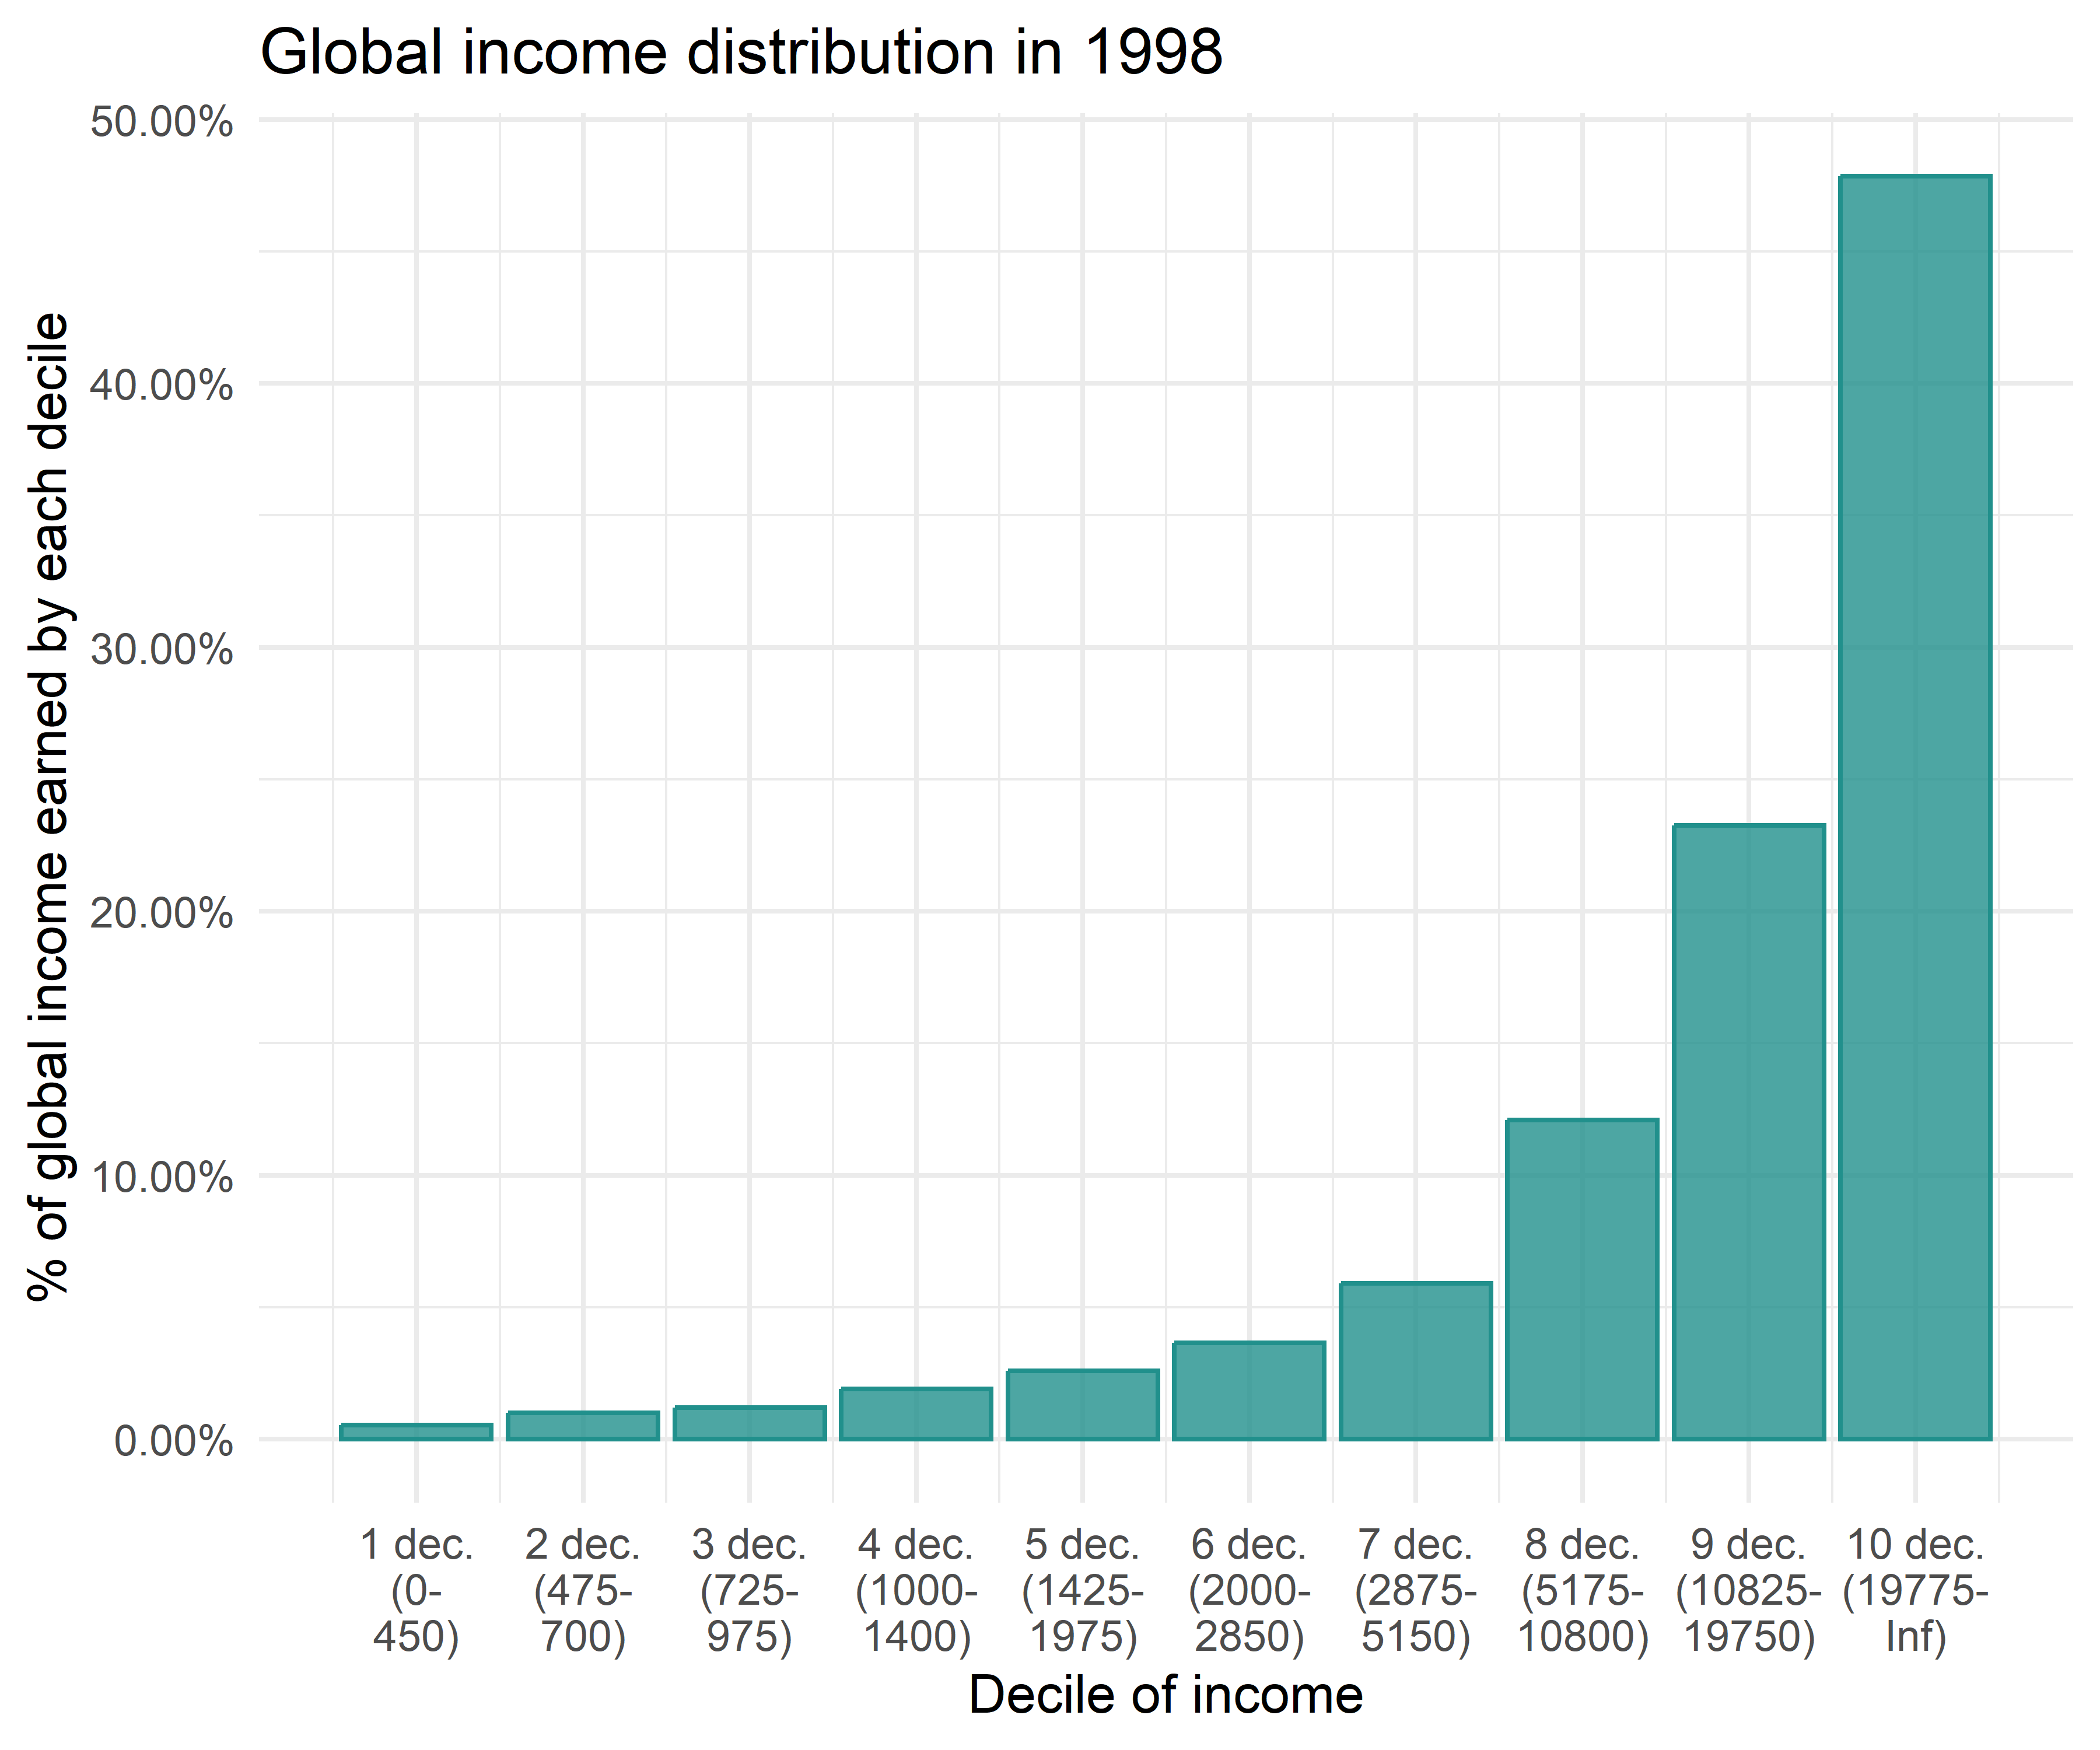
What does it show?
Where is the global income generated and distributed?
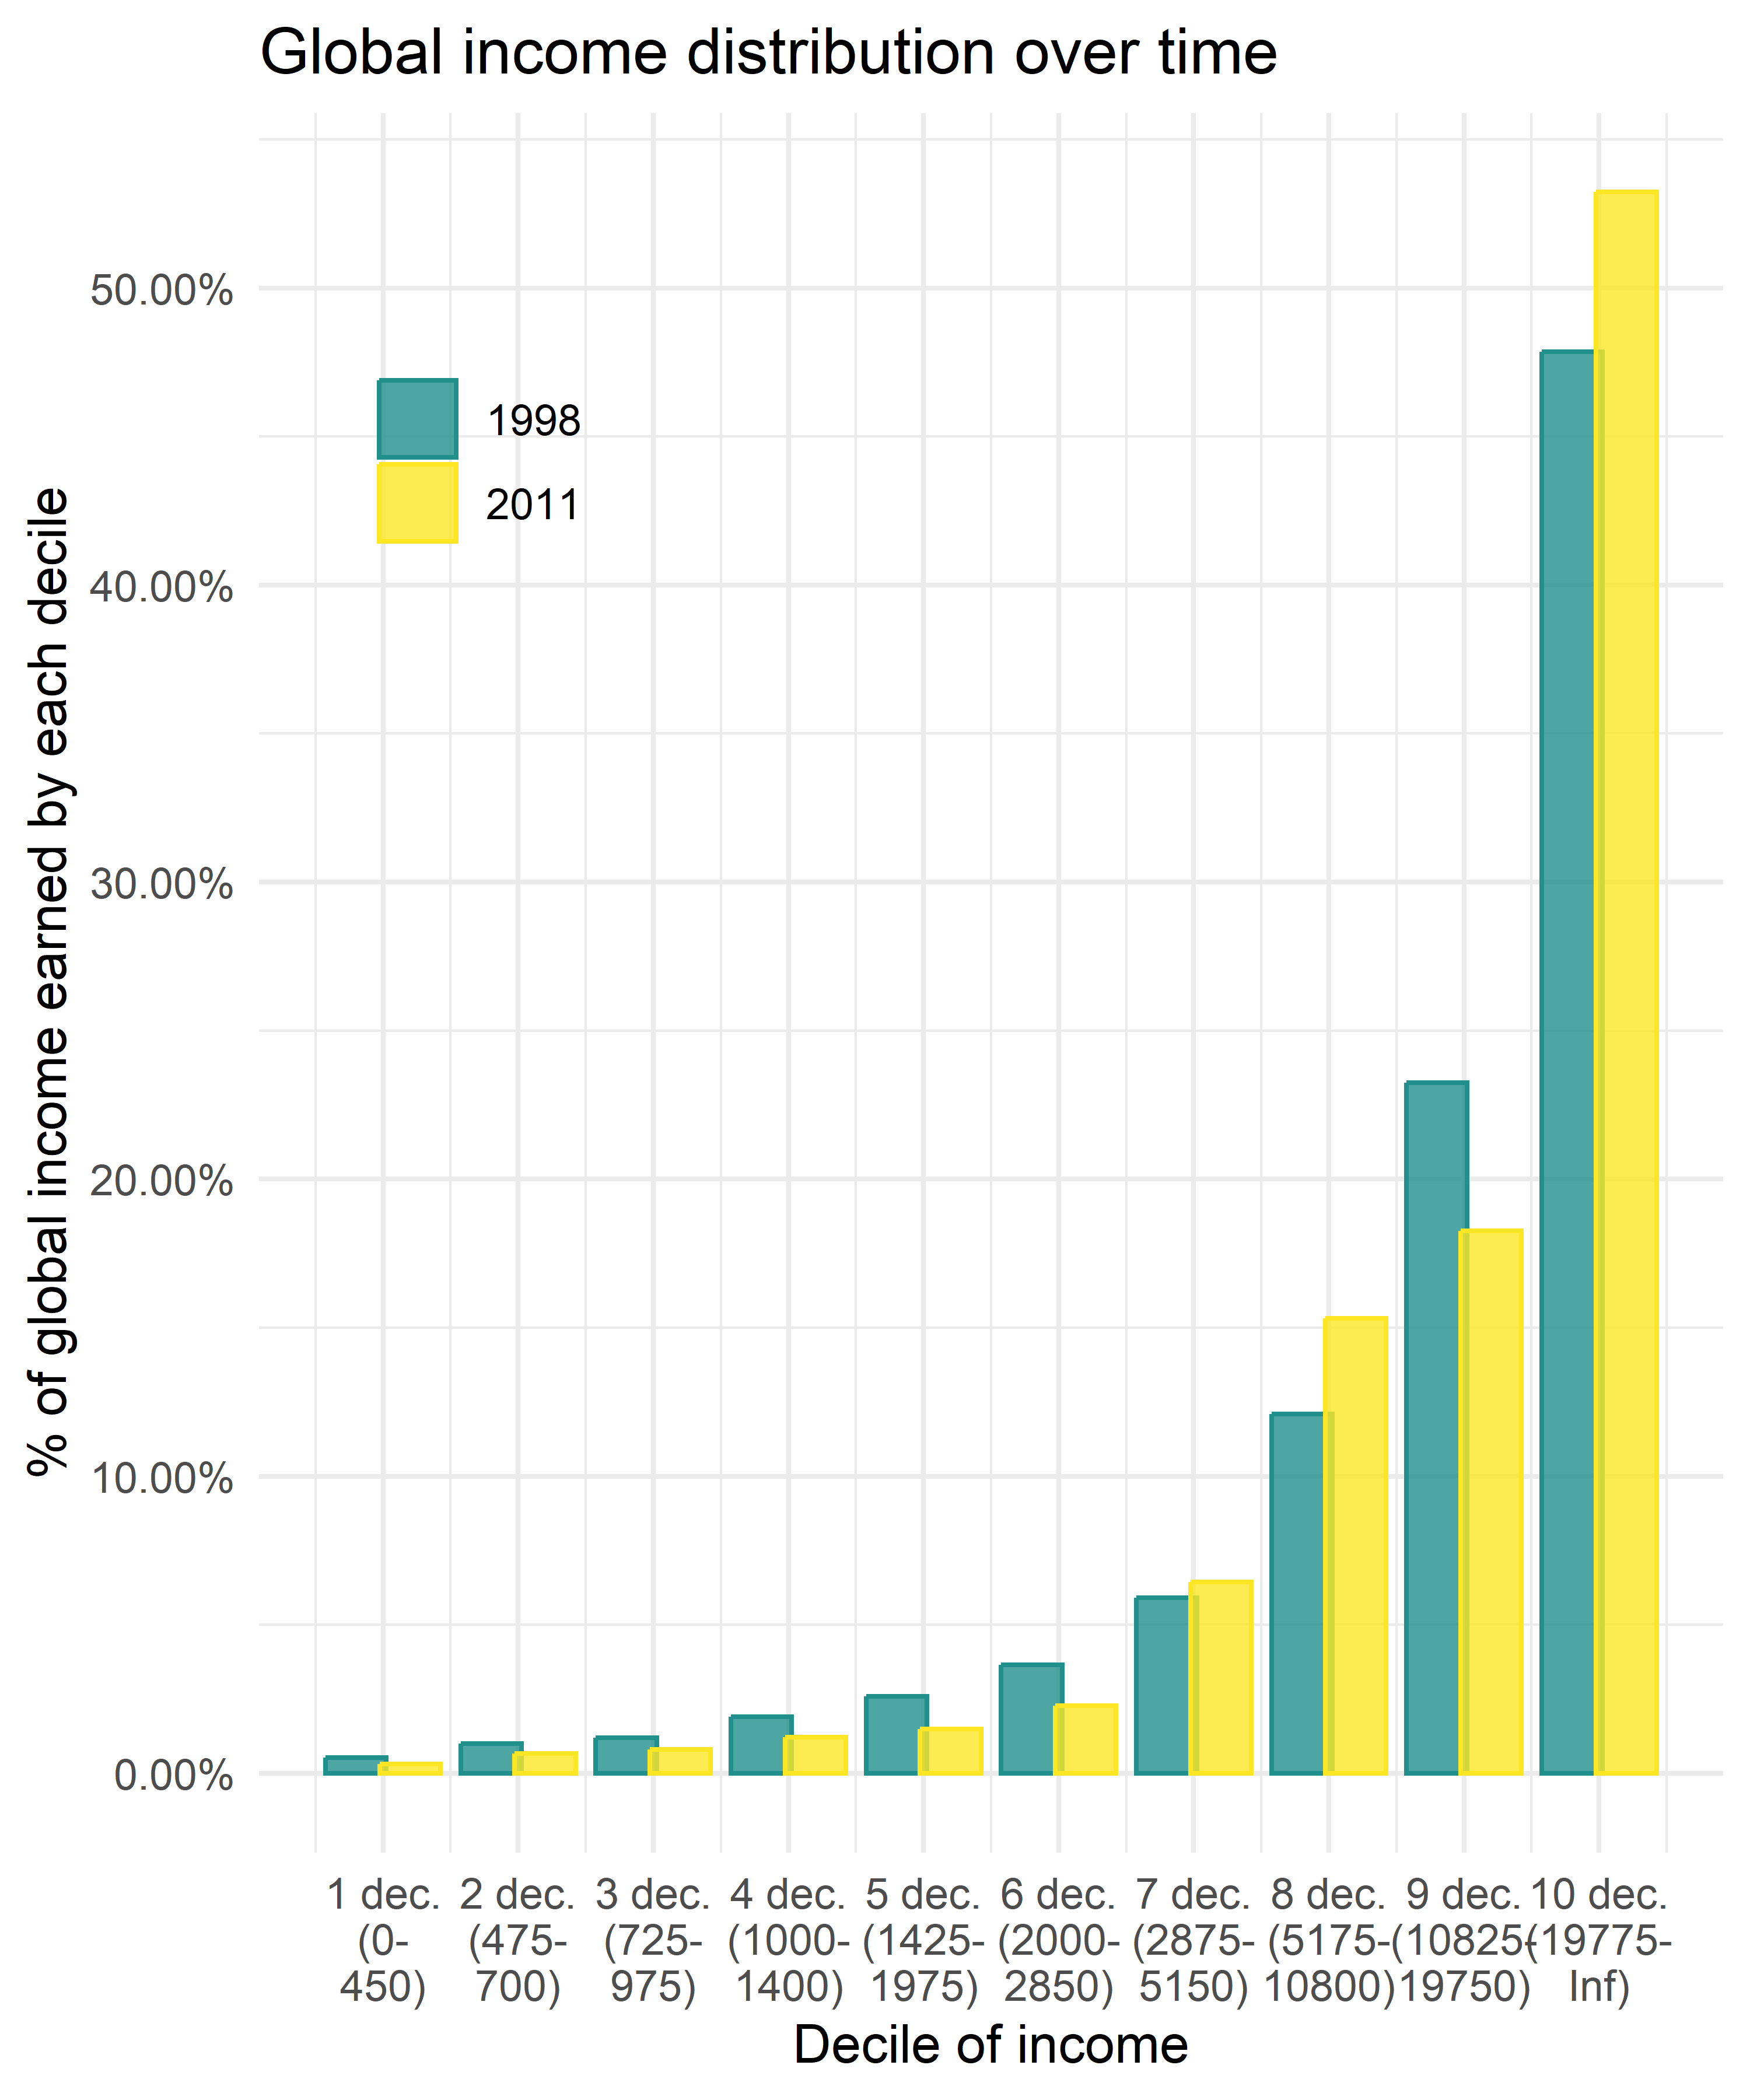
Deciles (5). Change over time
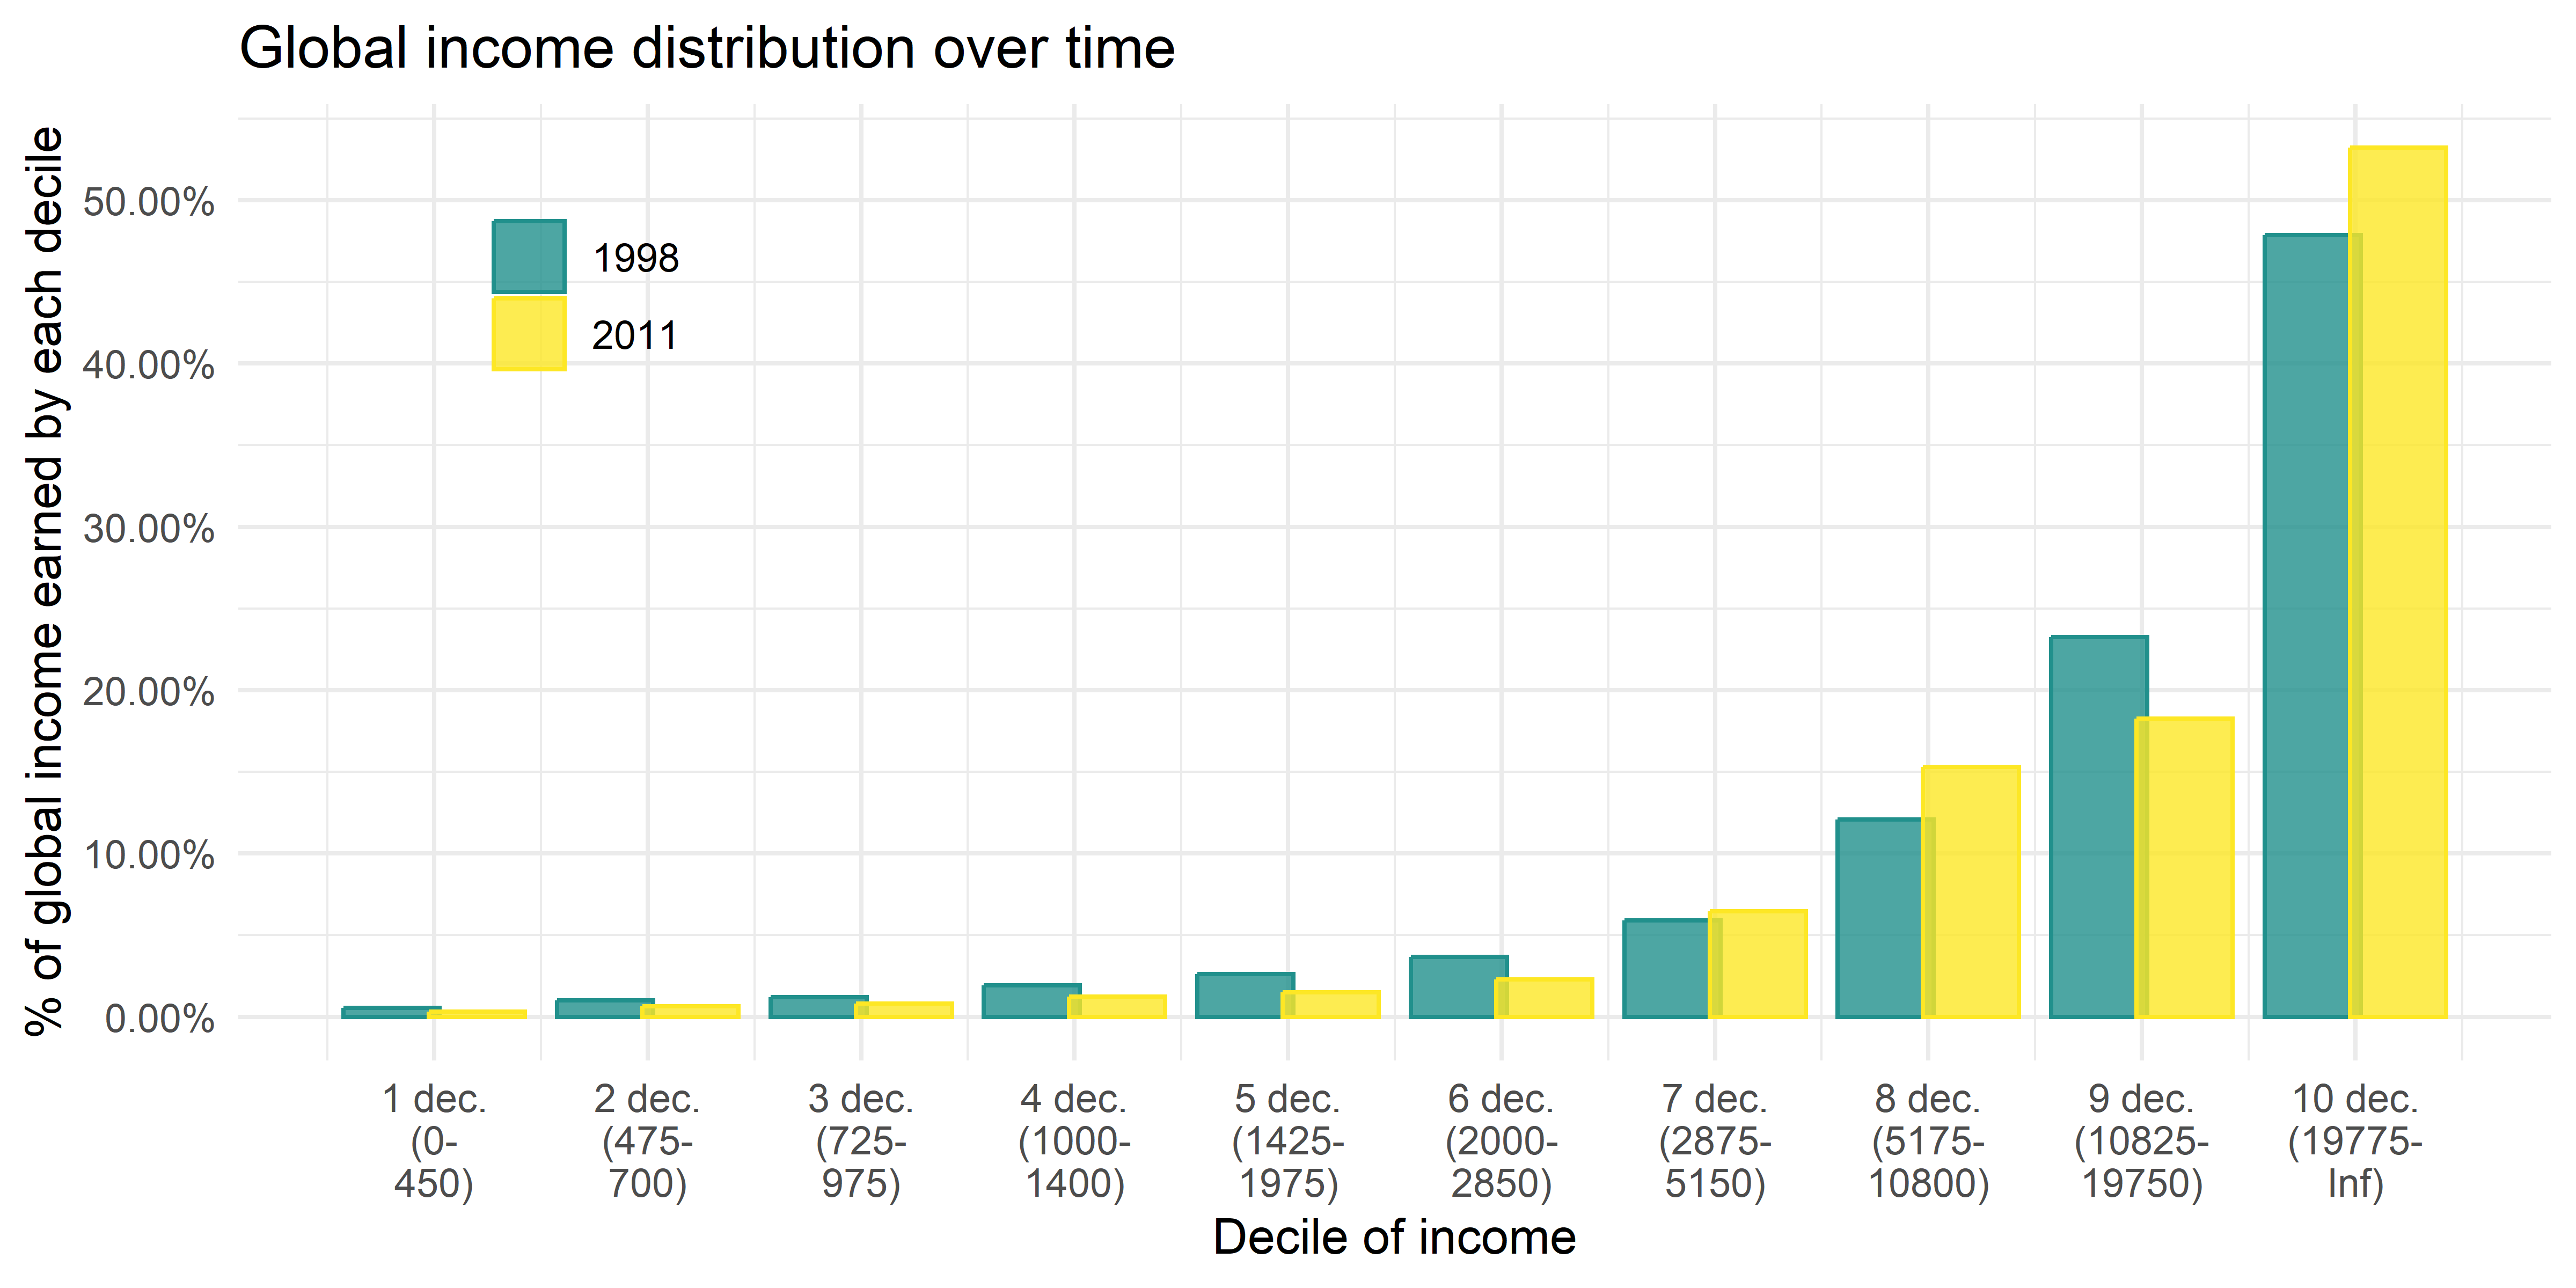
What had changed between 1998 and 2011?
Deciles (6). By country
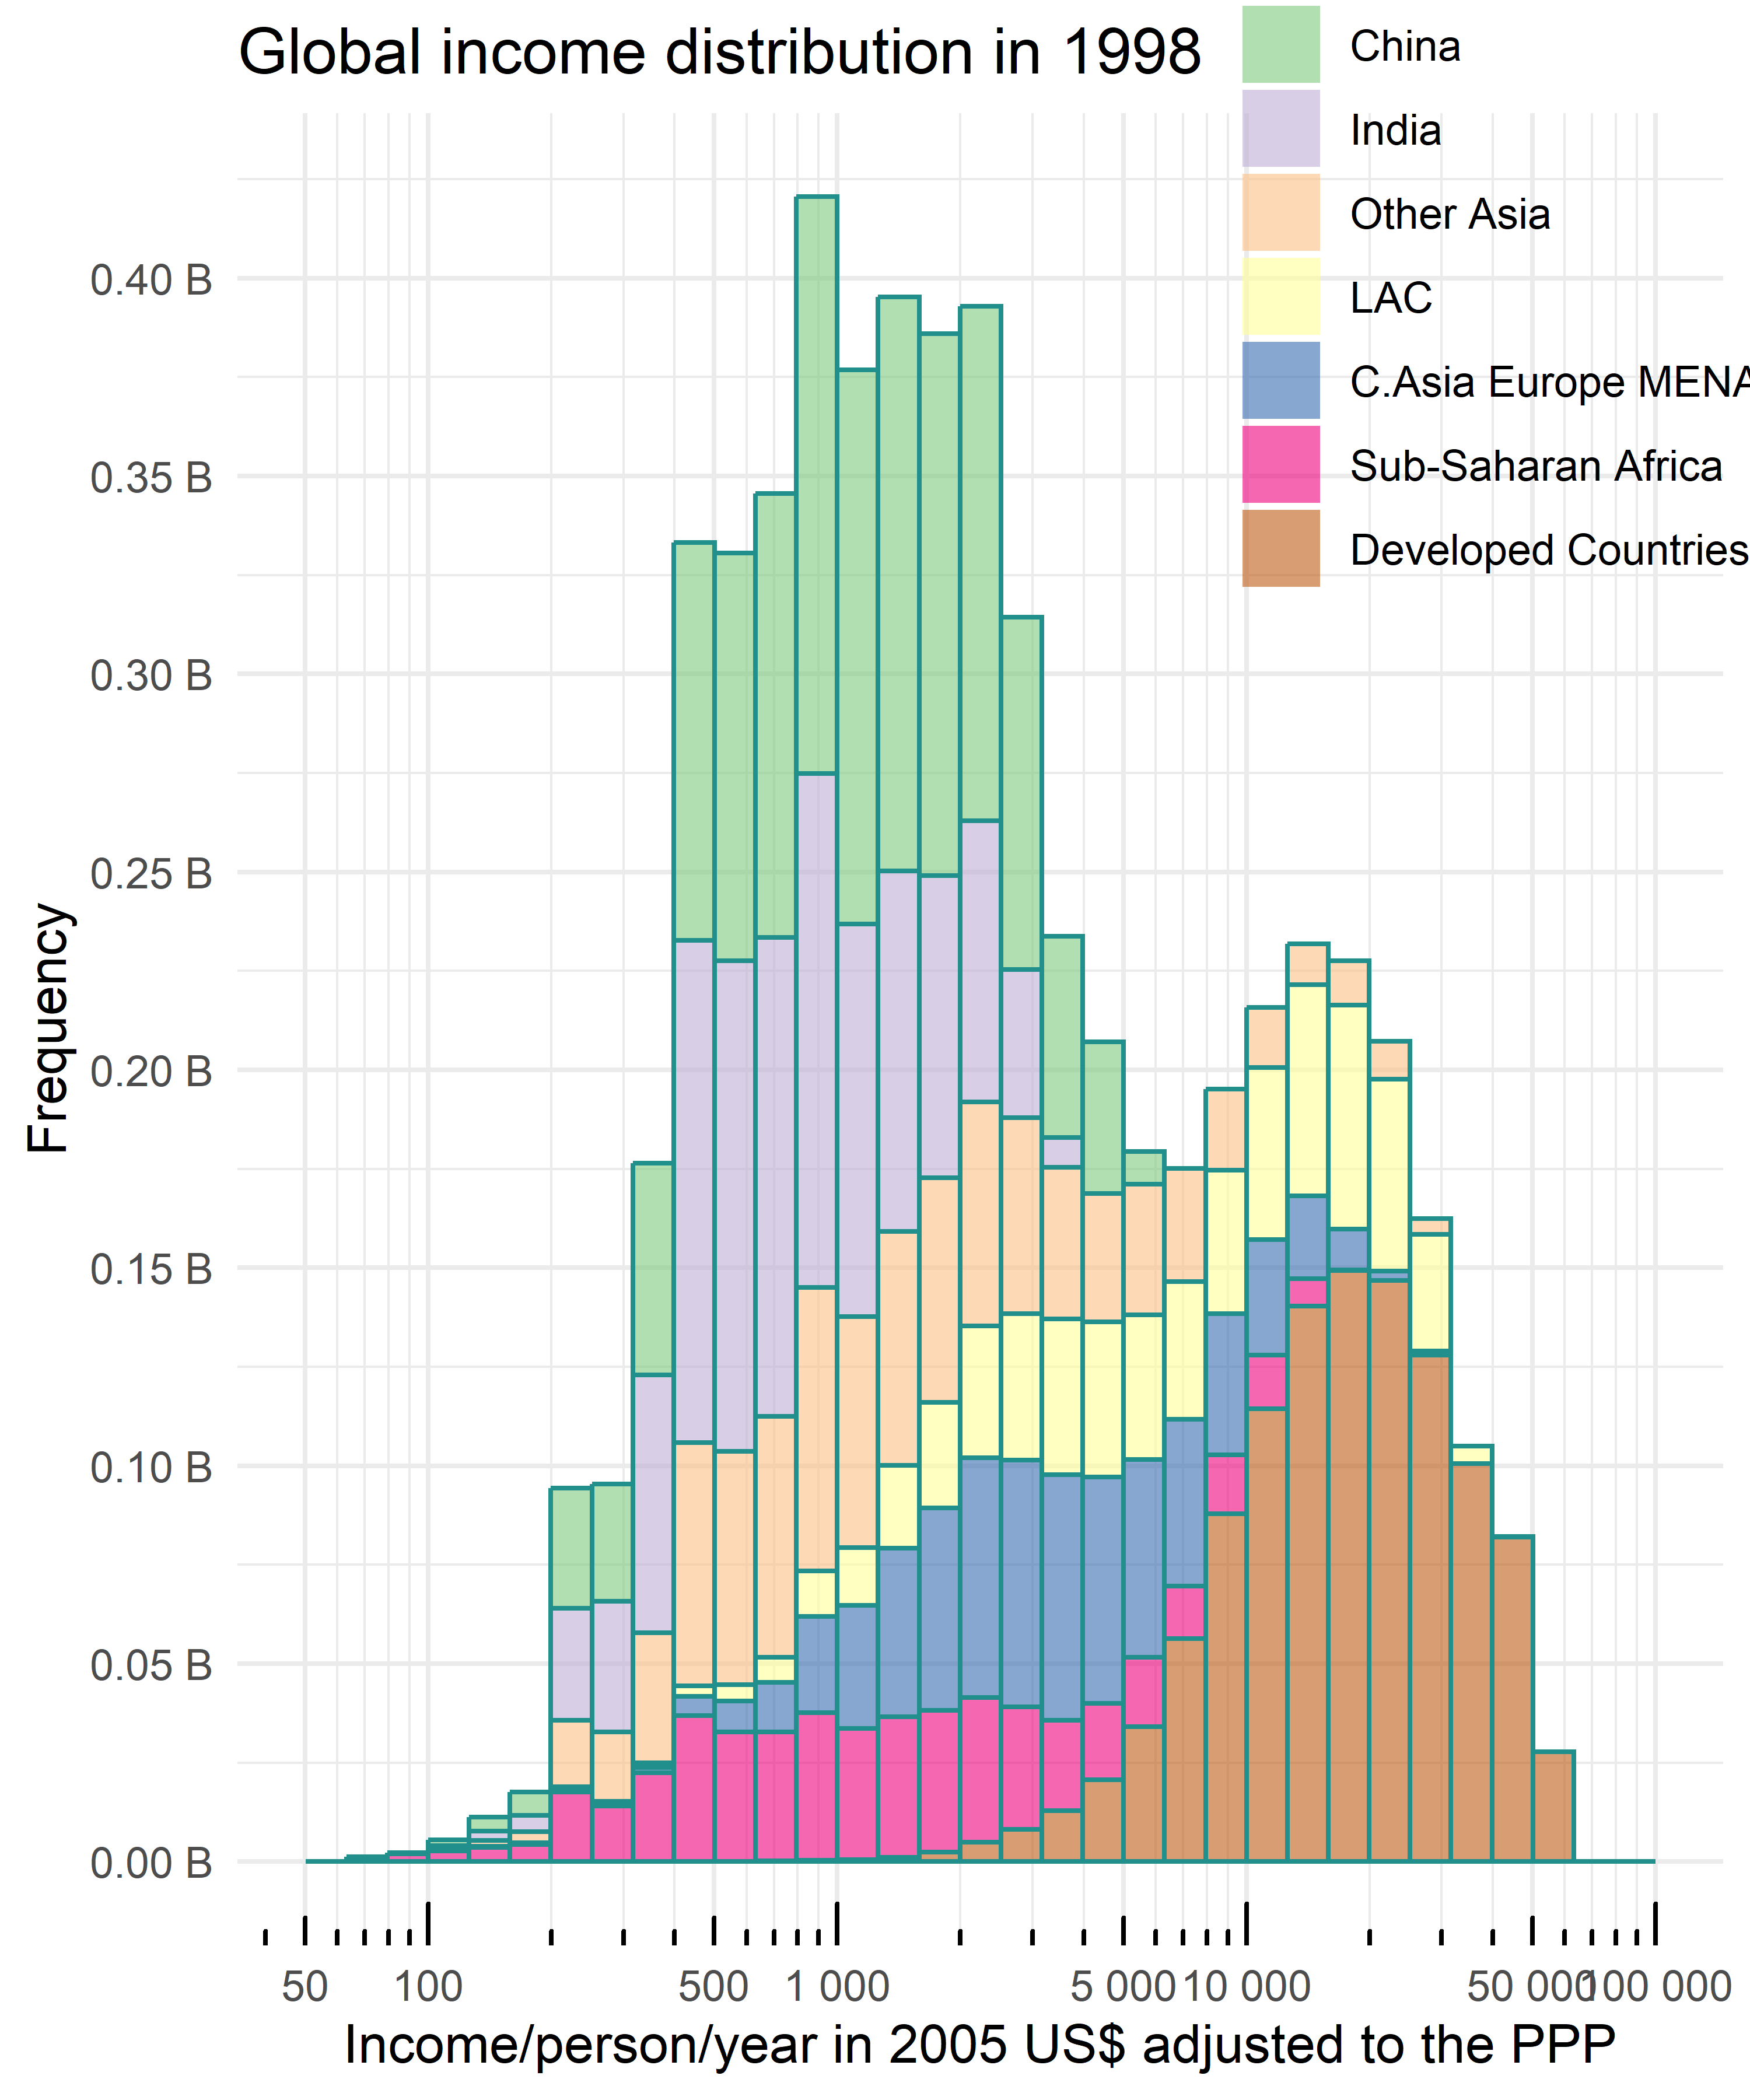
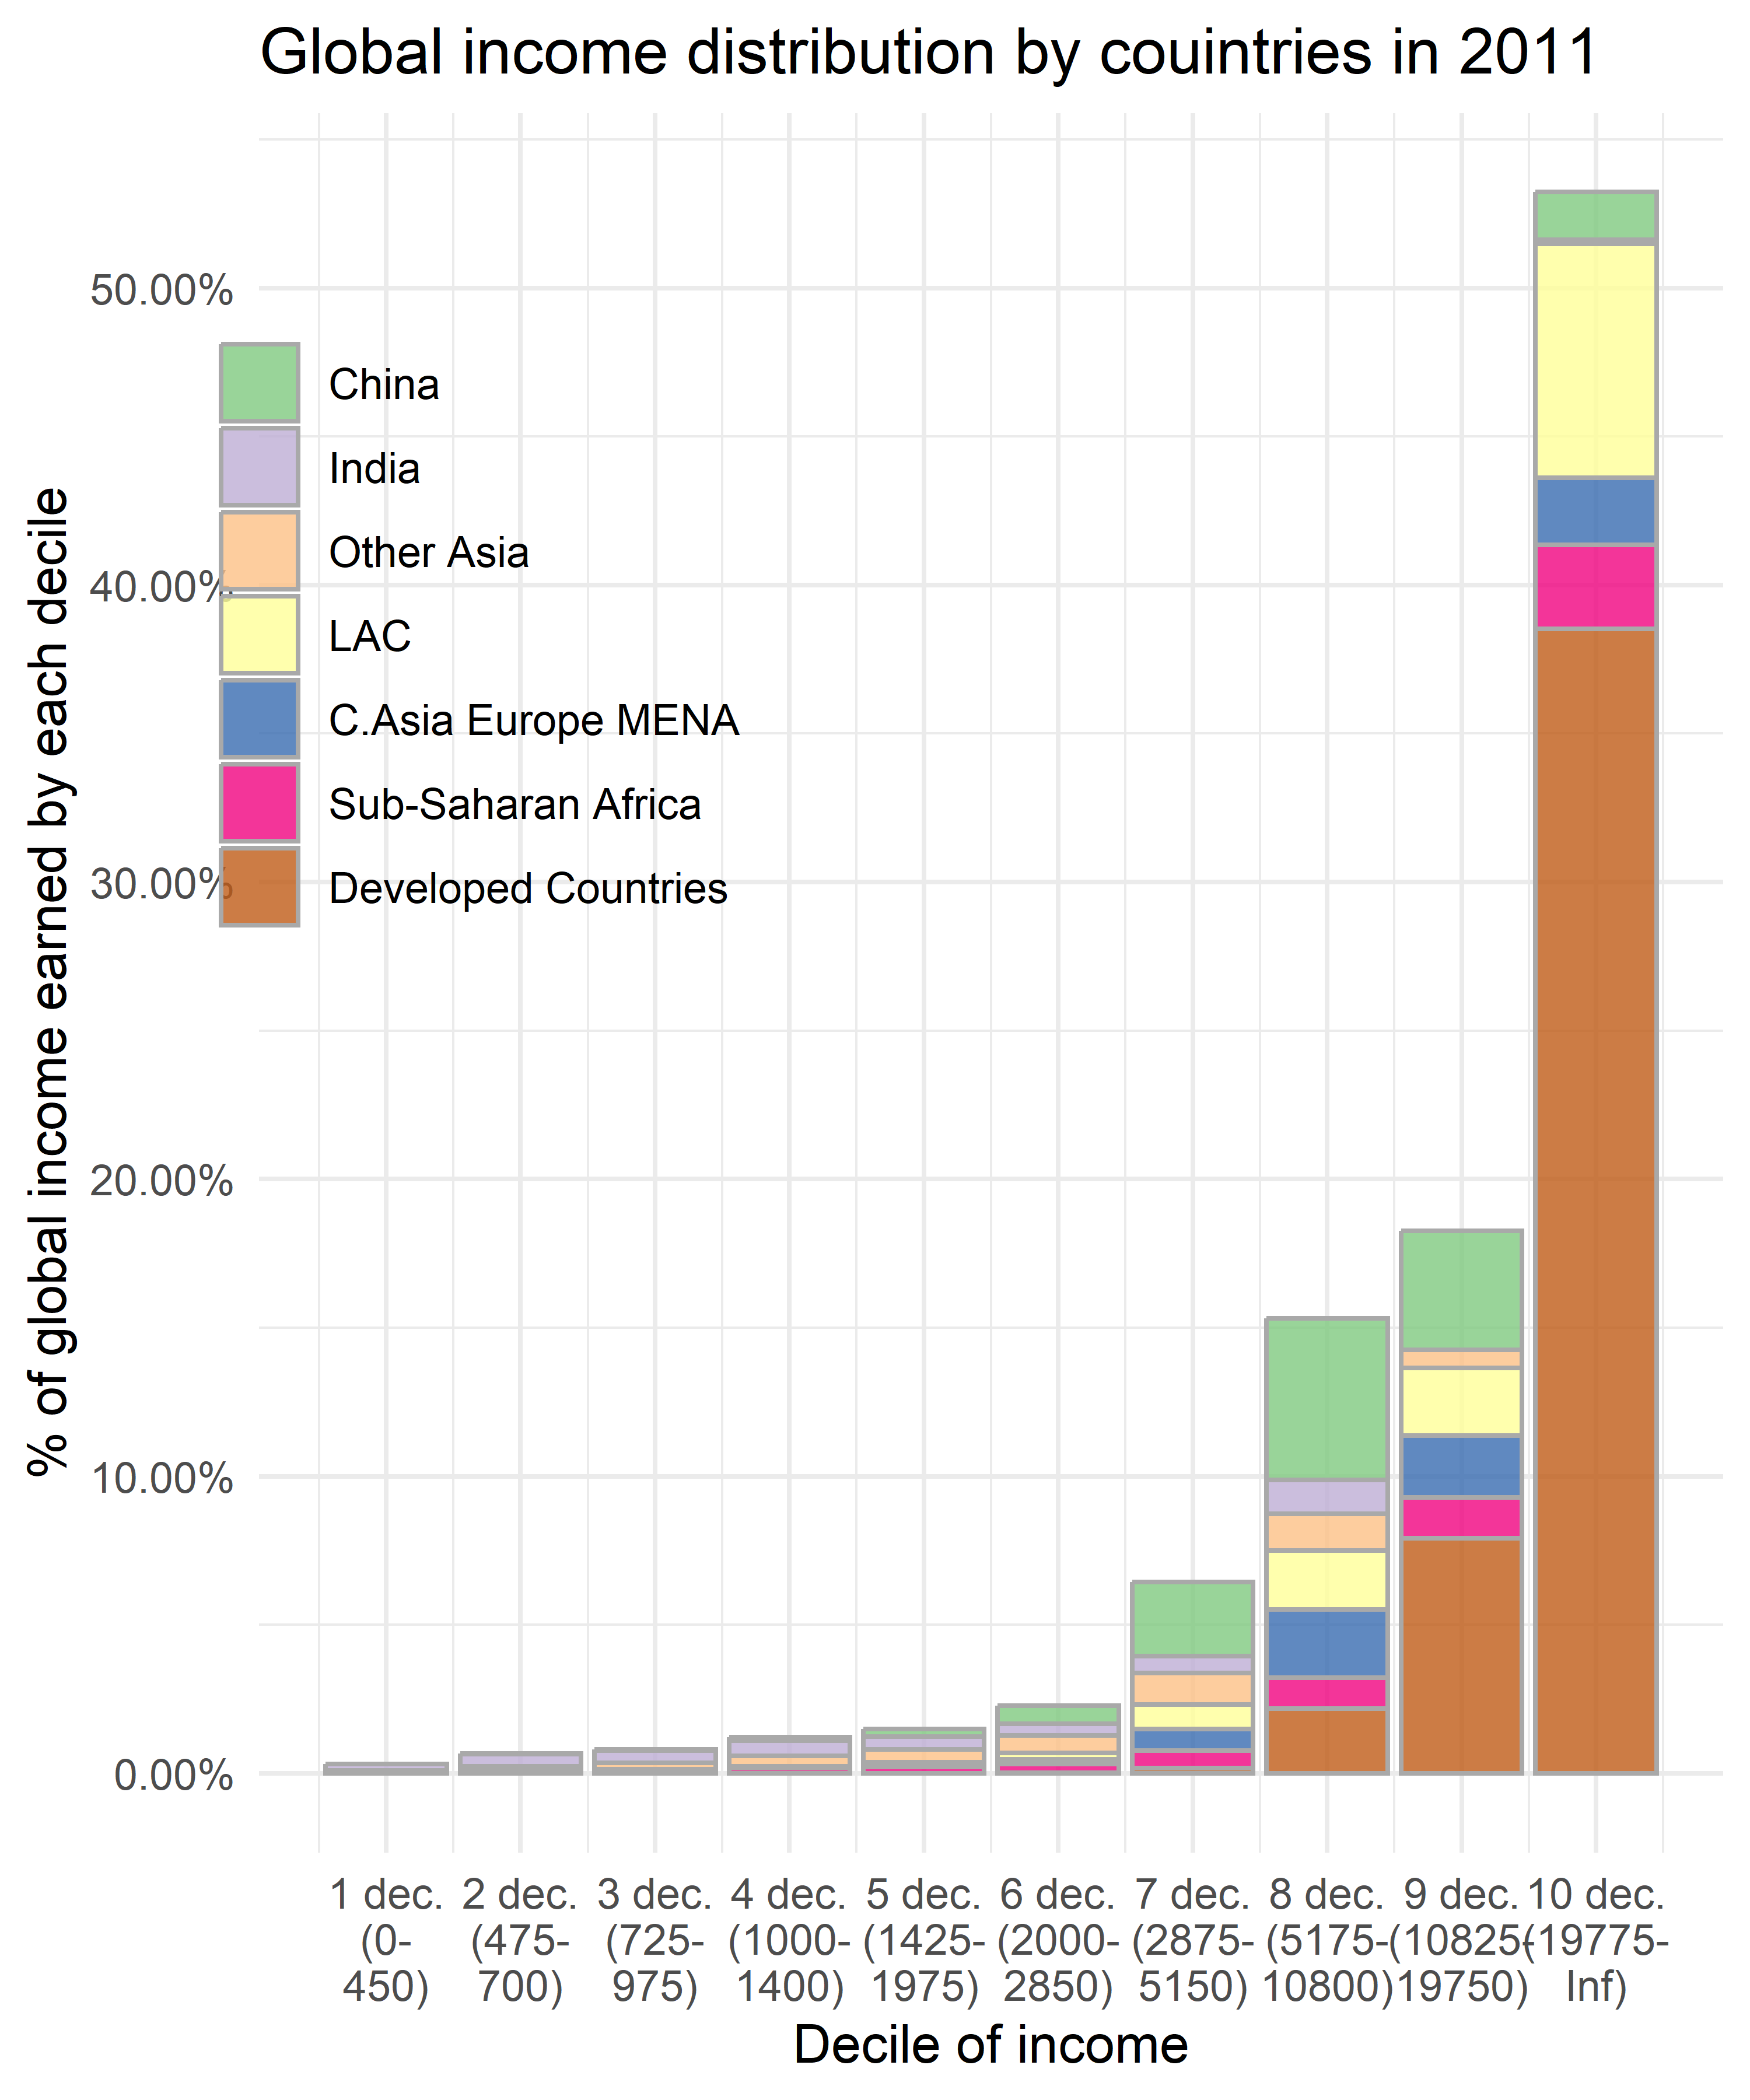
Deciles (7). By country