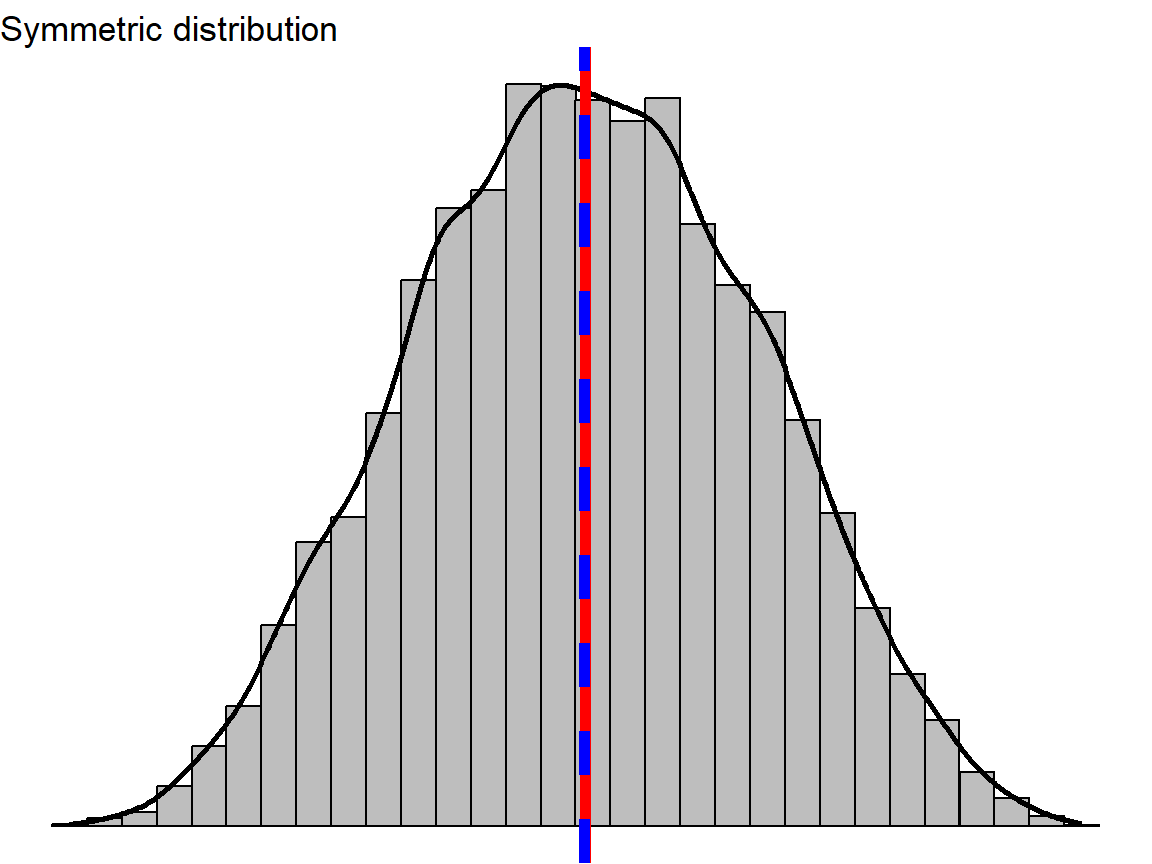
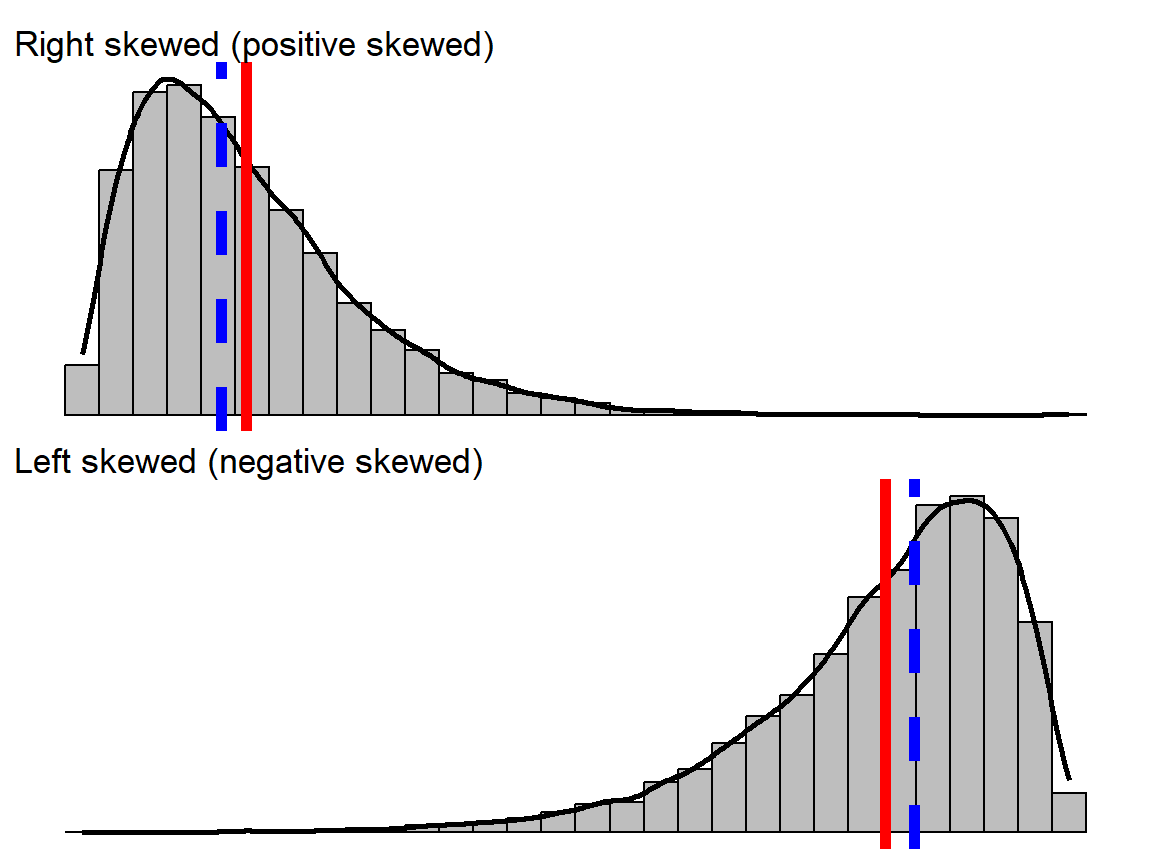
Symmetric vs Non symmetric
Extreem and influential observations
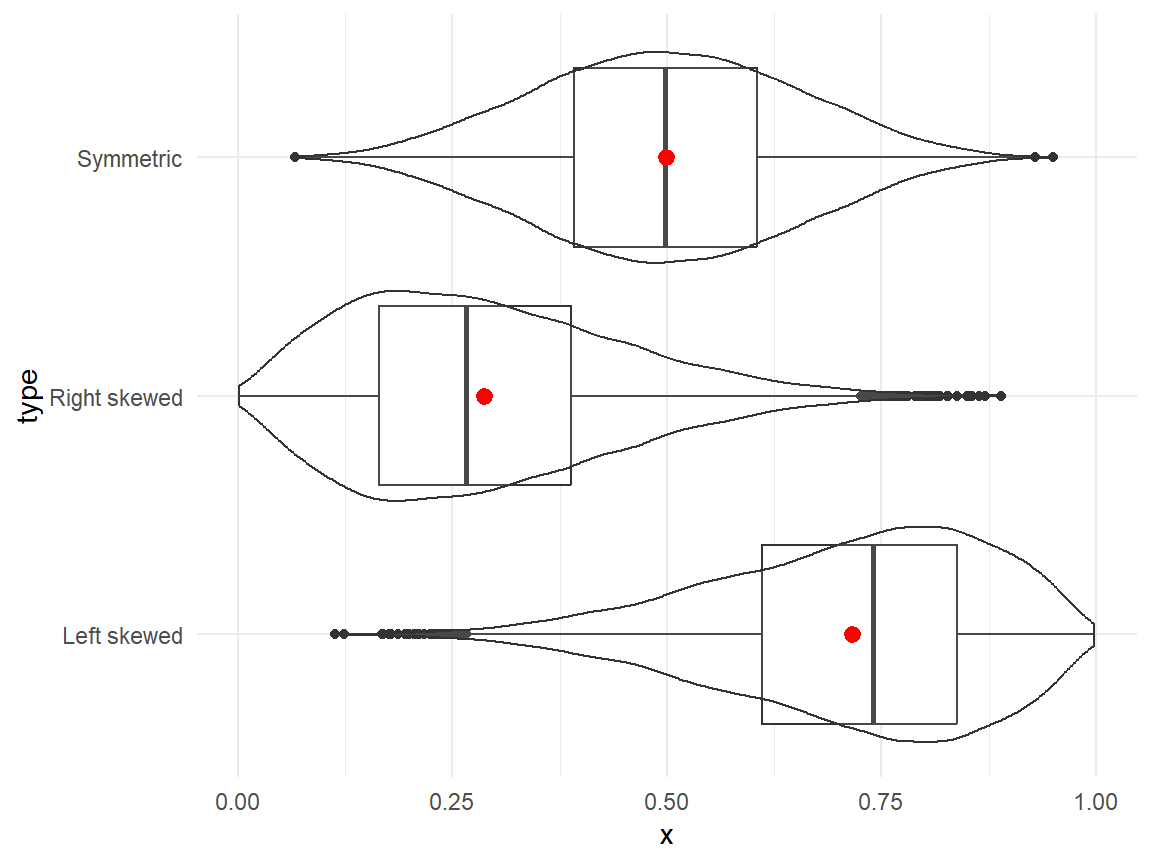
Mean is heavily affected by influential observations.
Median is more robust.
From a density to a cumulative distribution
How to:
Order all observation ascendingly.
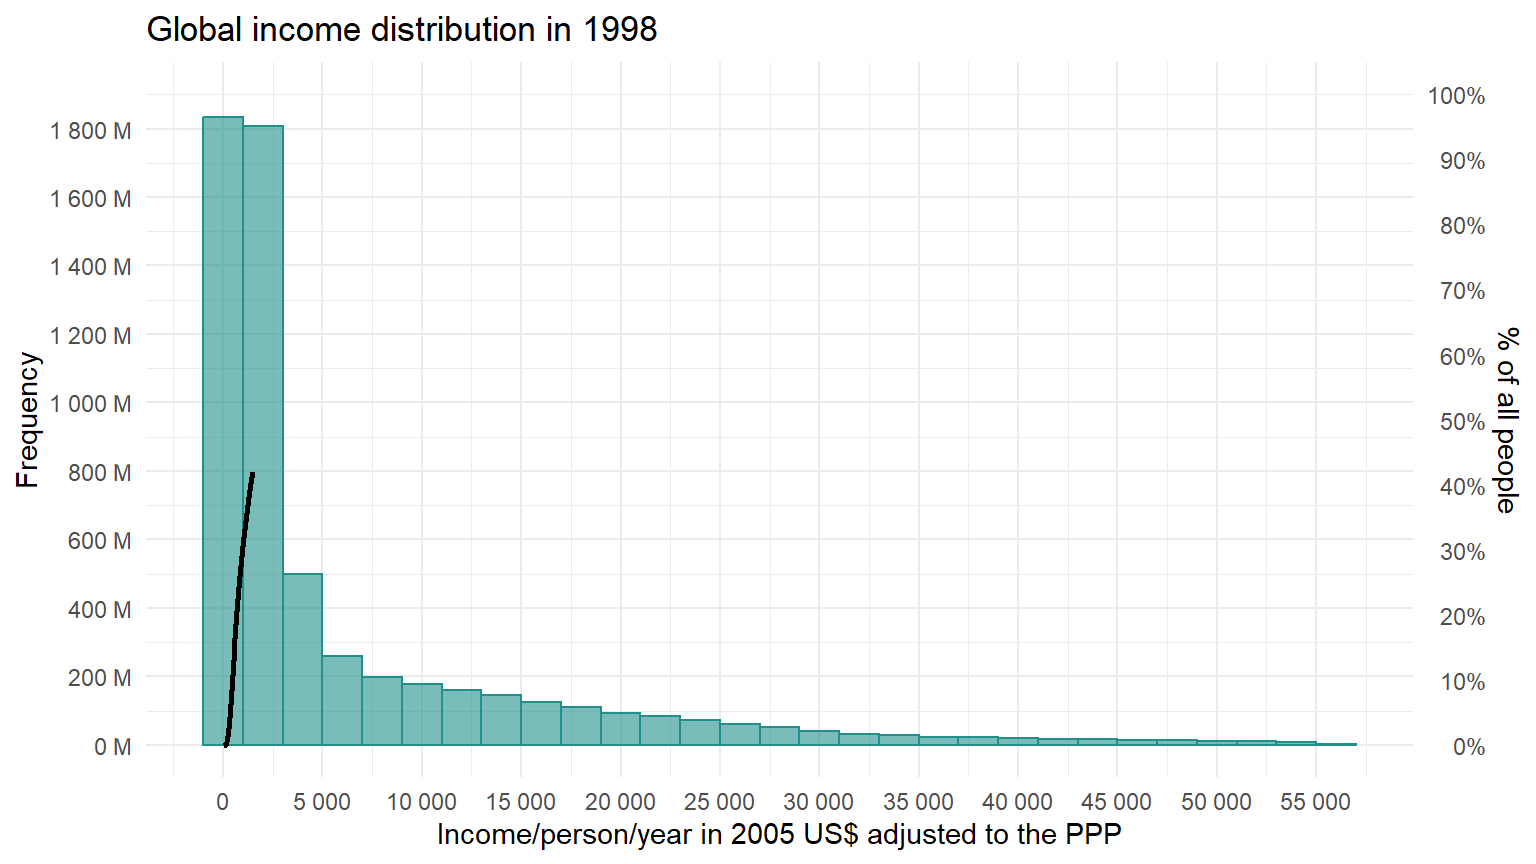
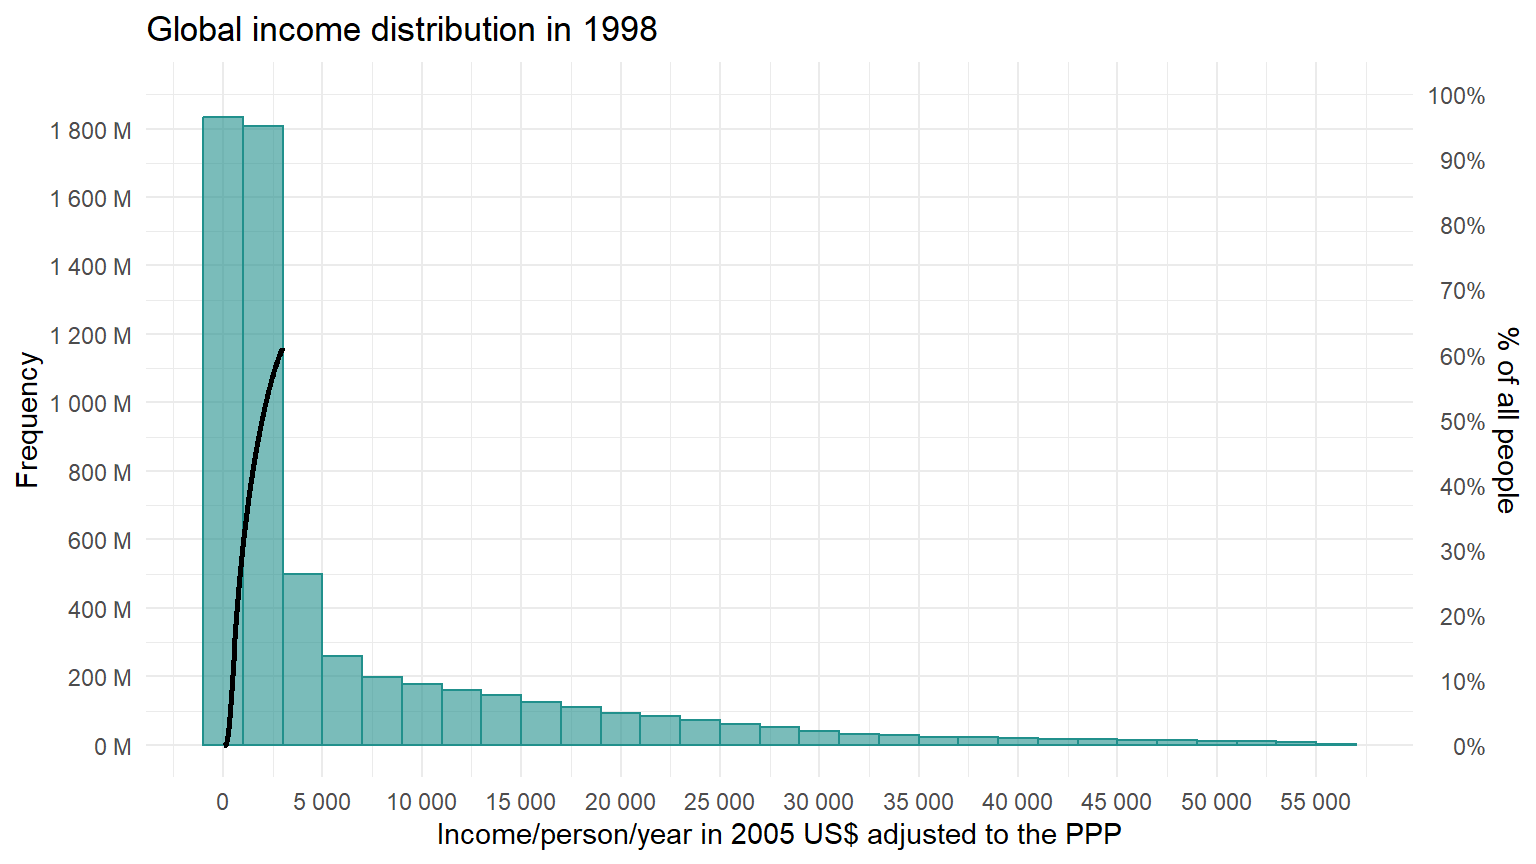
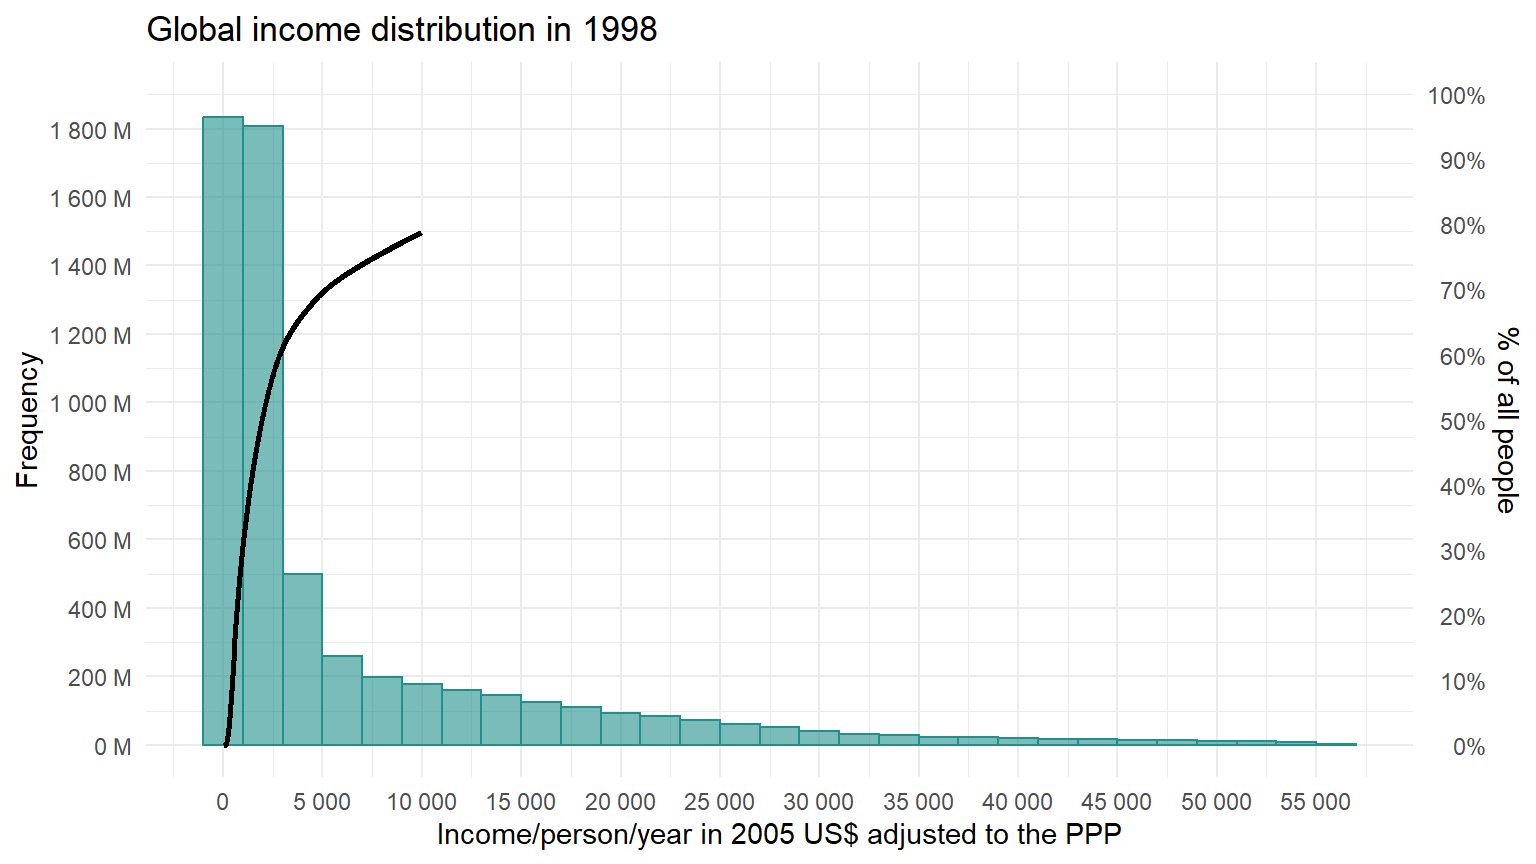
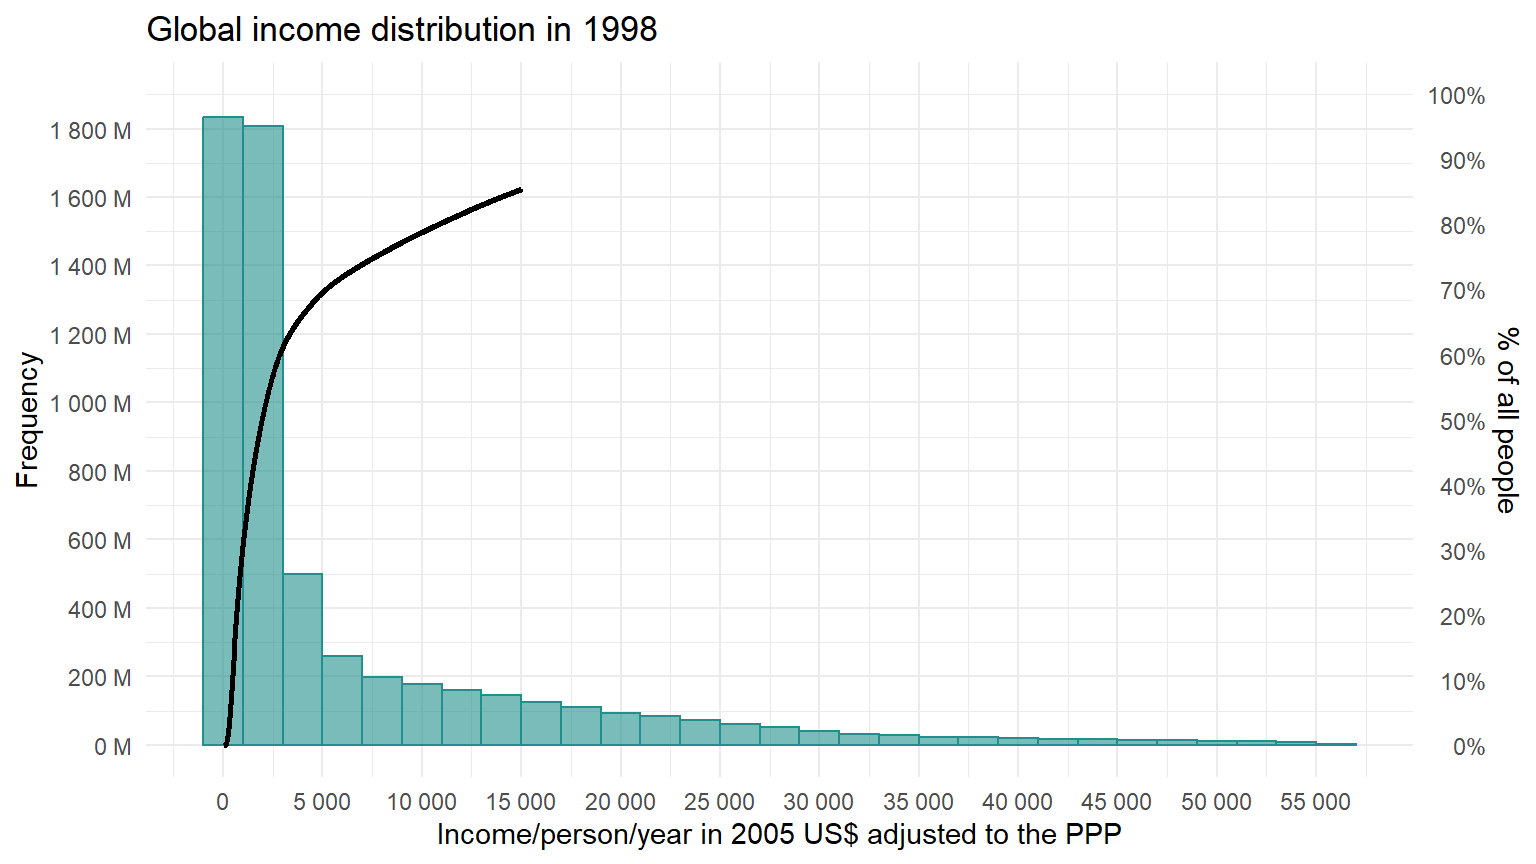
Plot cumulative frequency for every existing observation on Y axis.
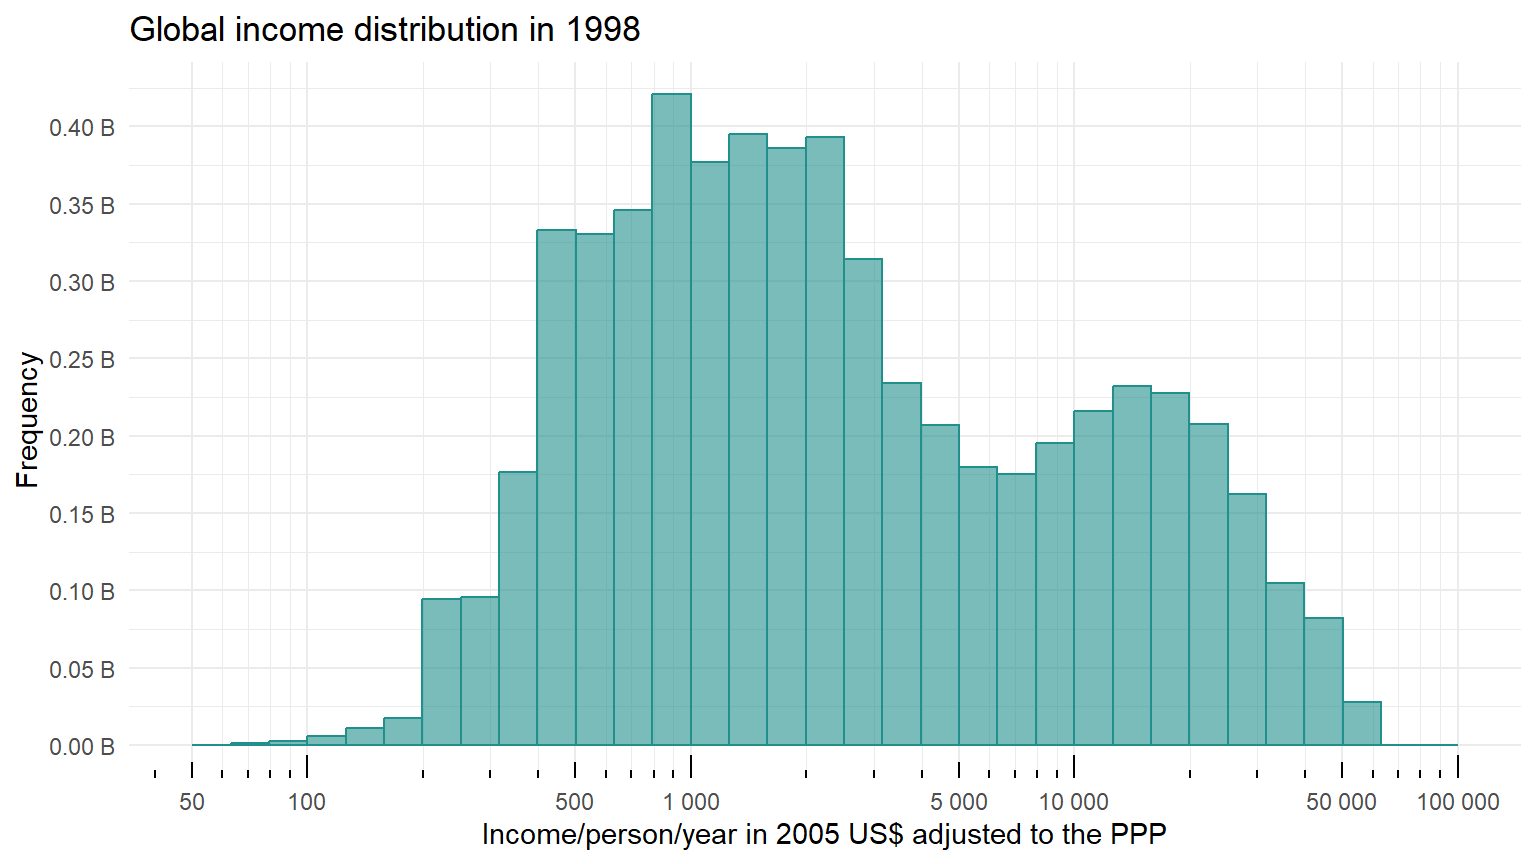
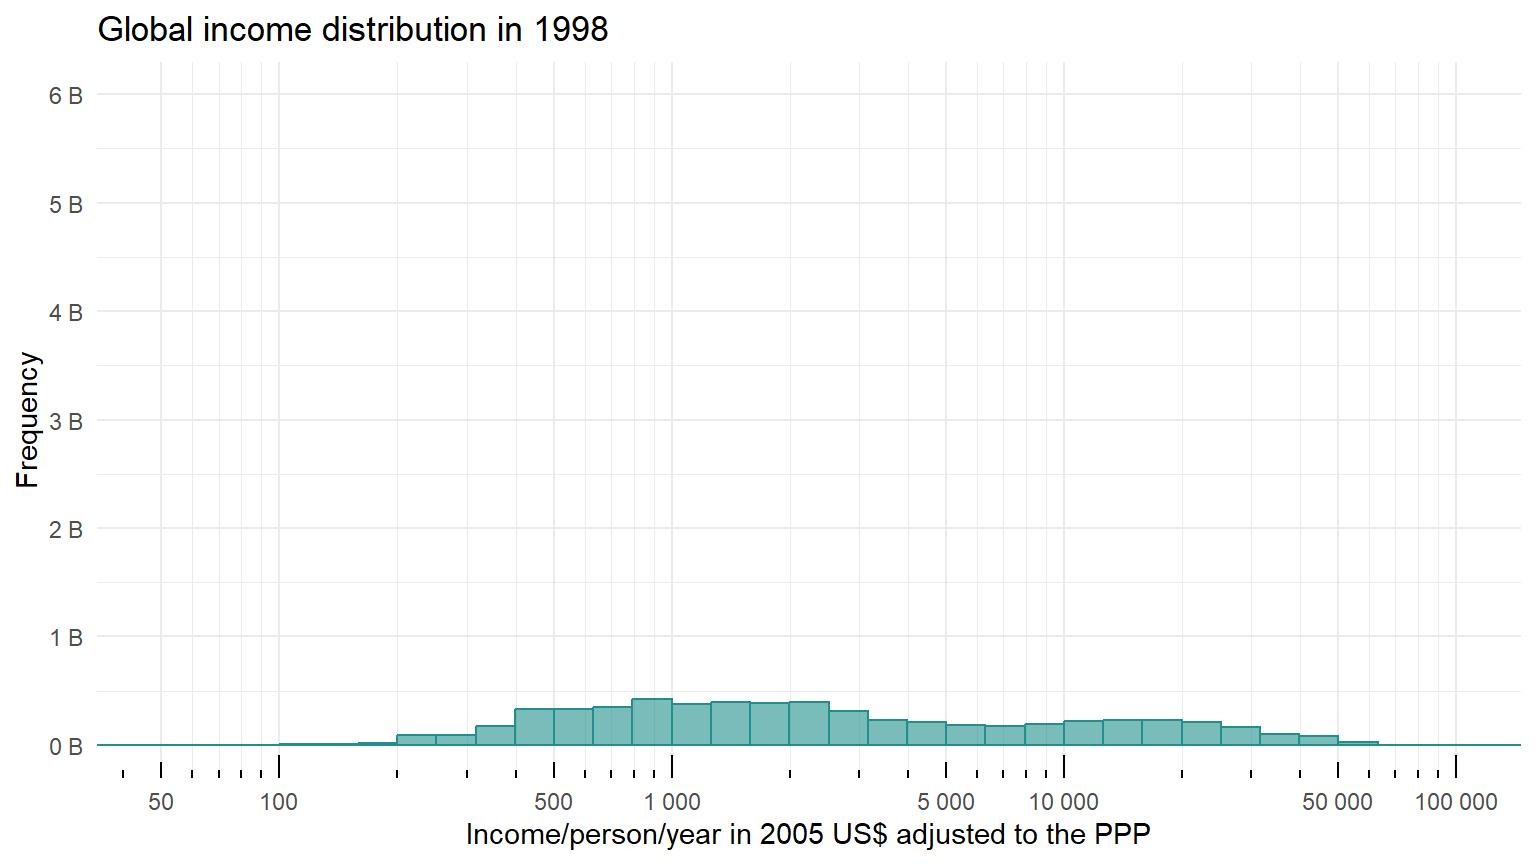
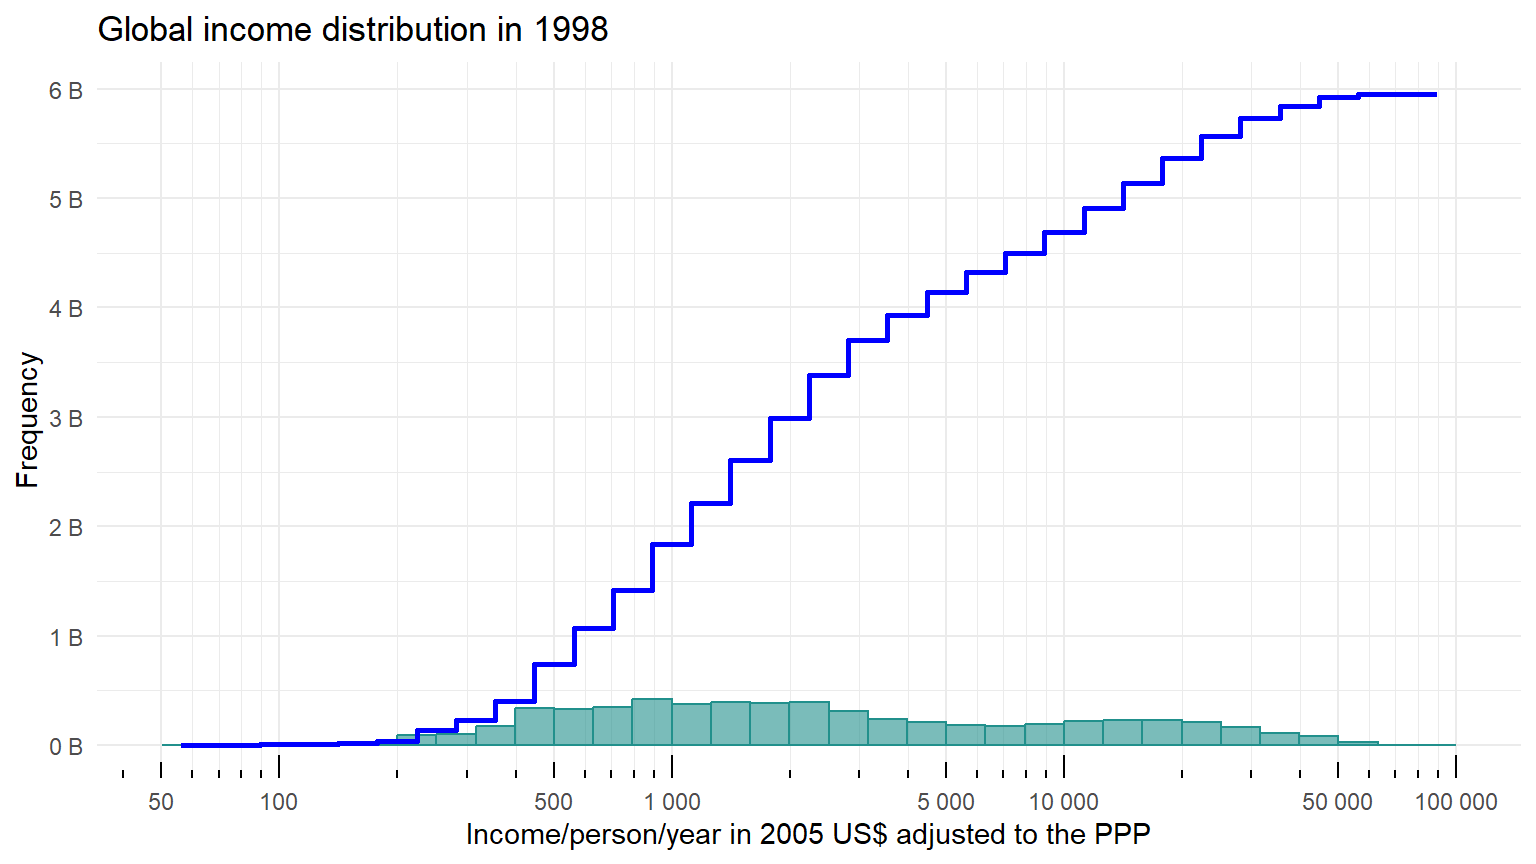
Cumulative distribution of income (1)
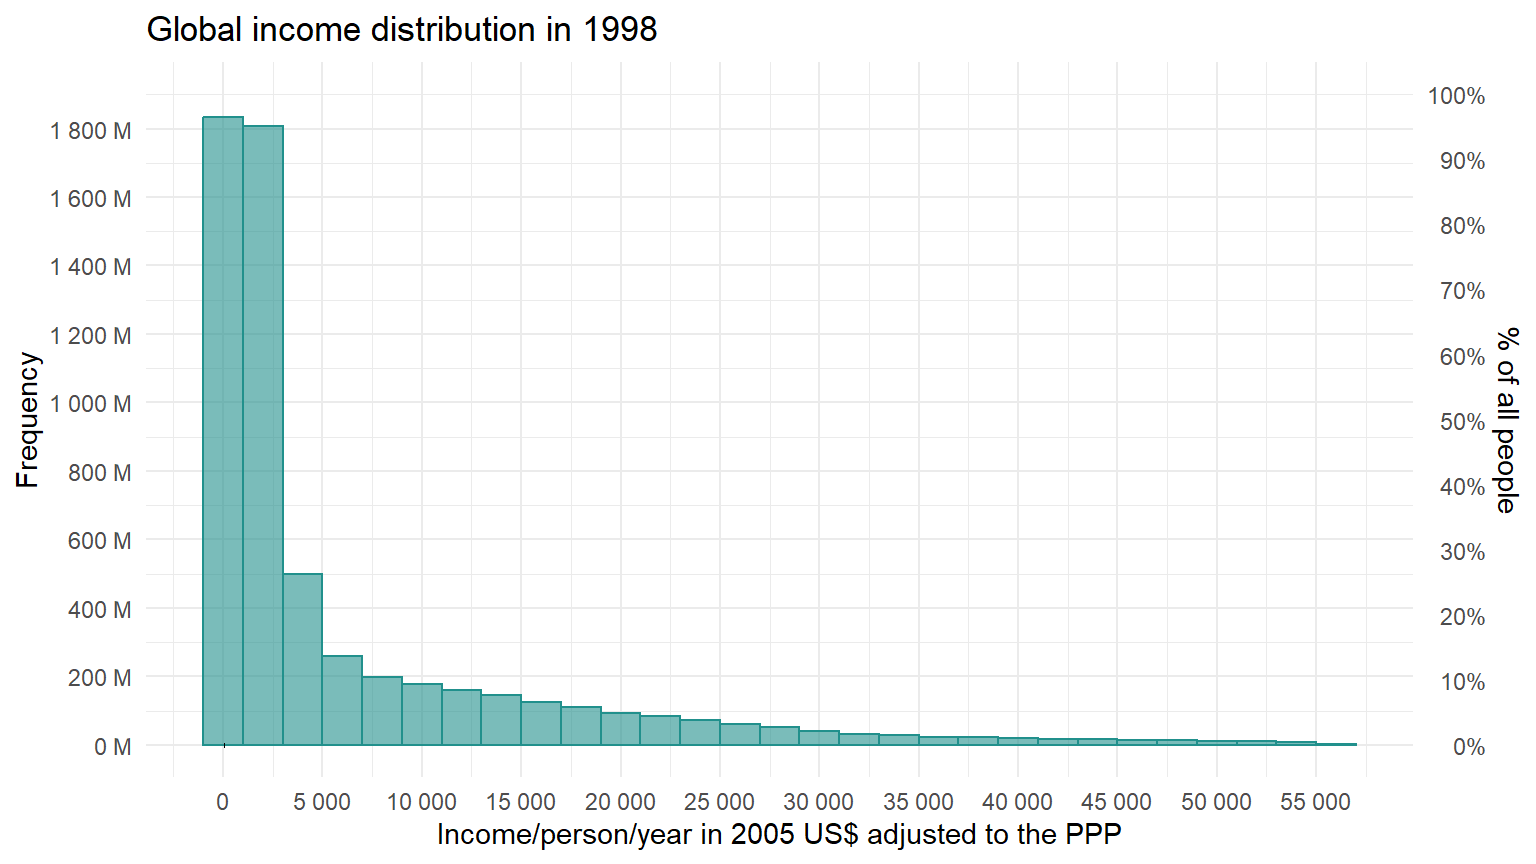
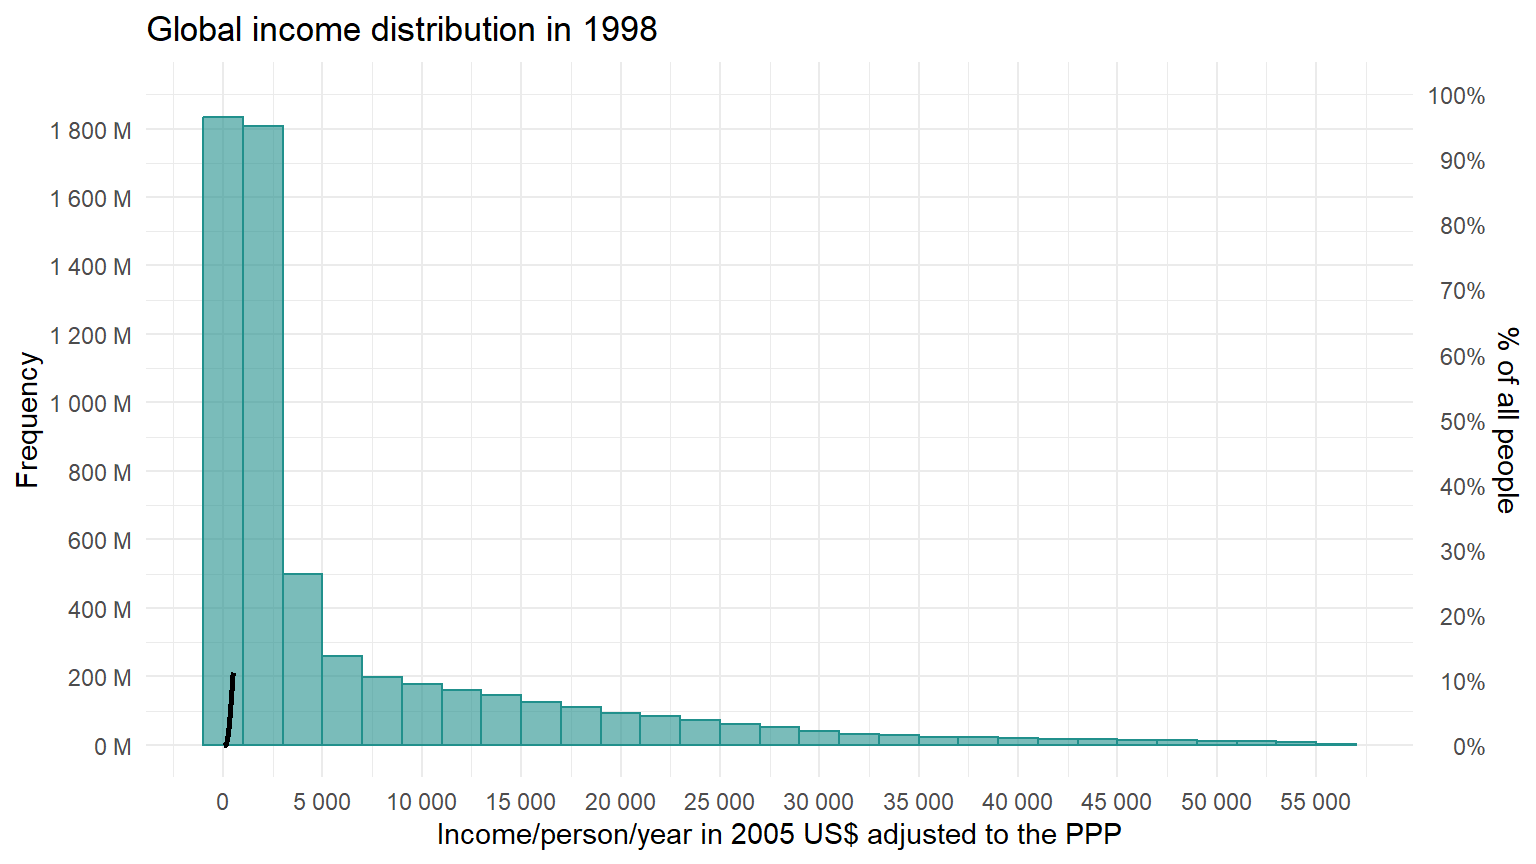
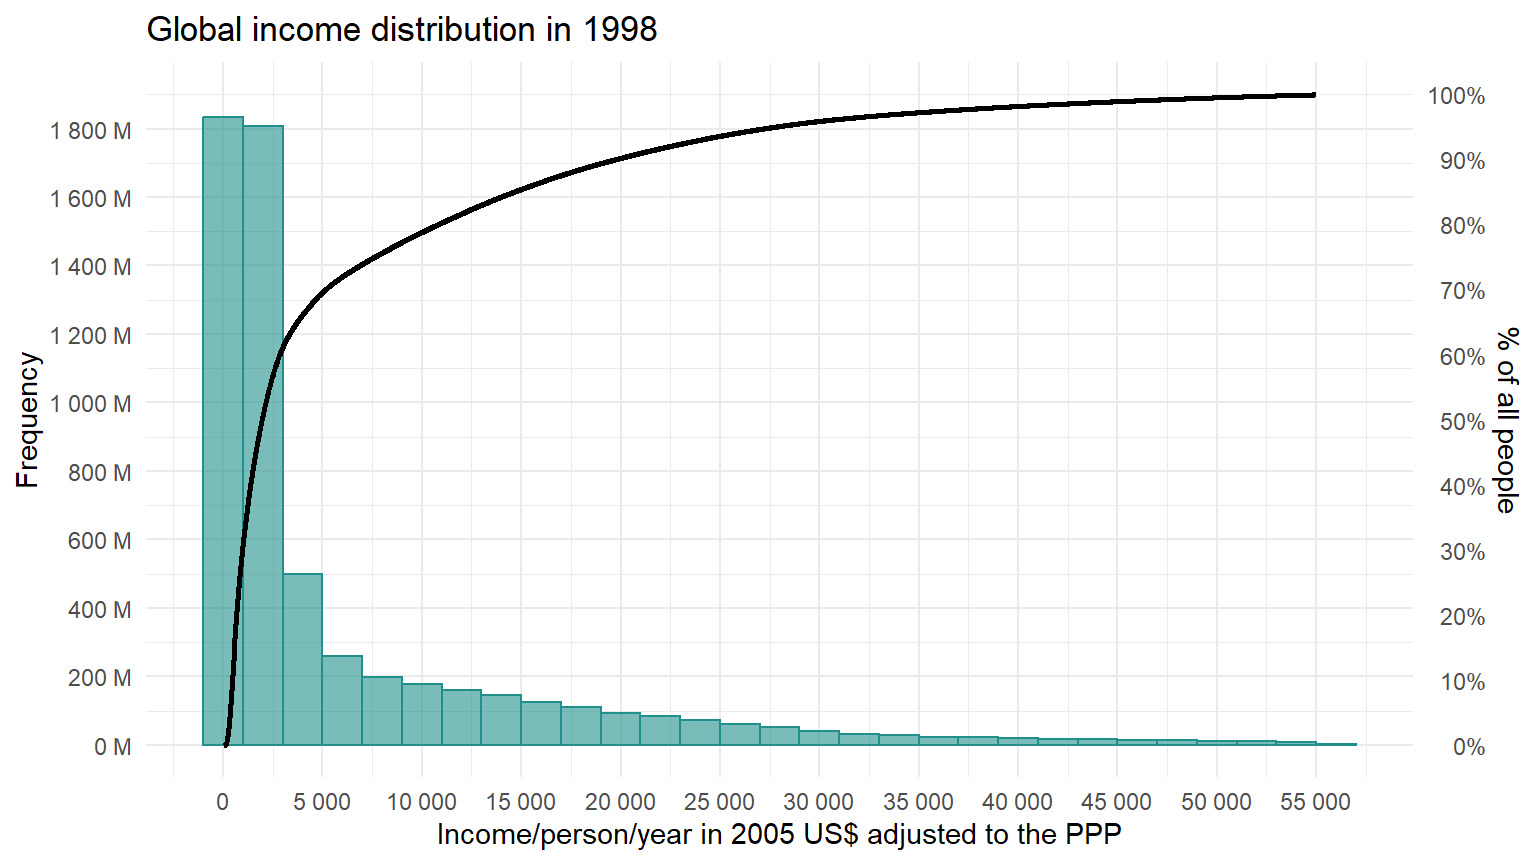
Income inequality
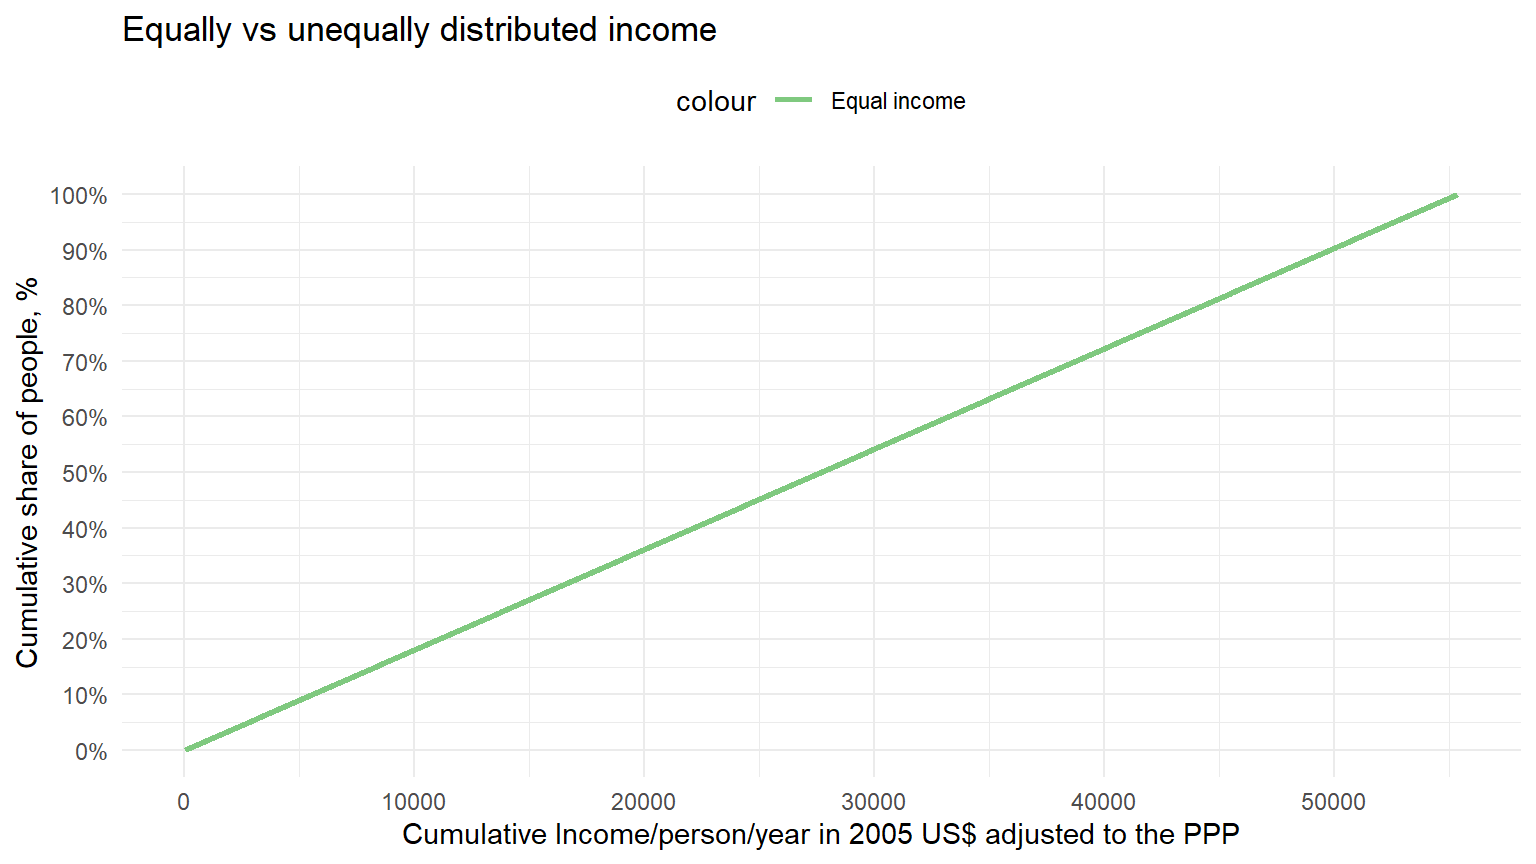
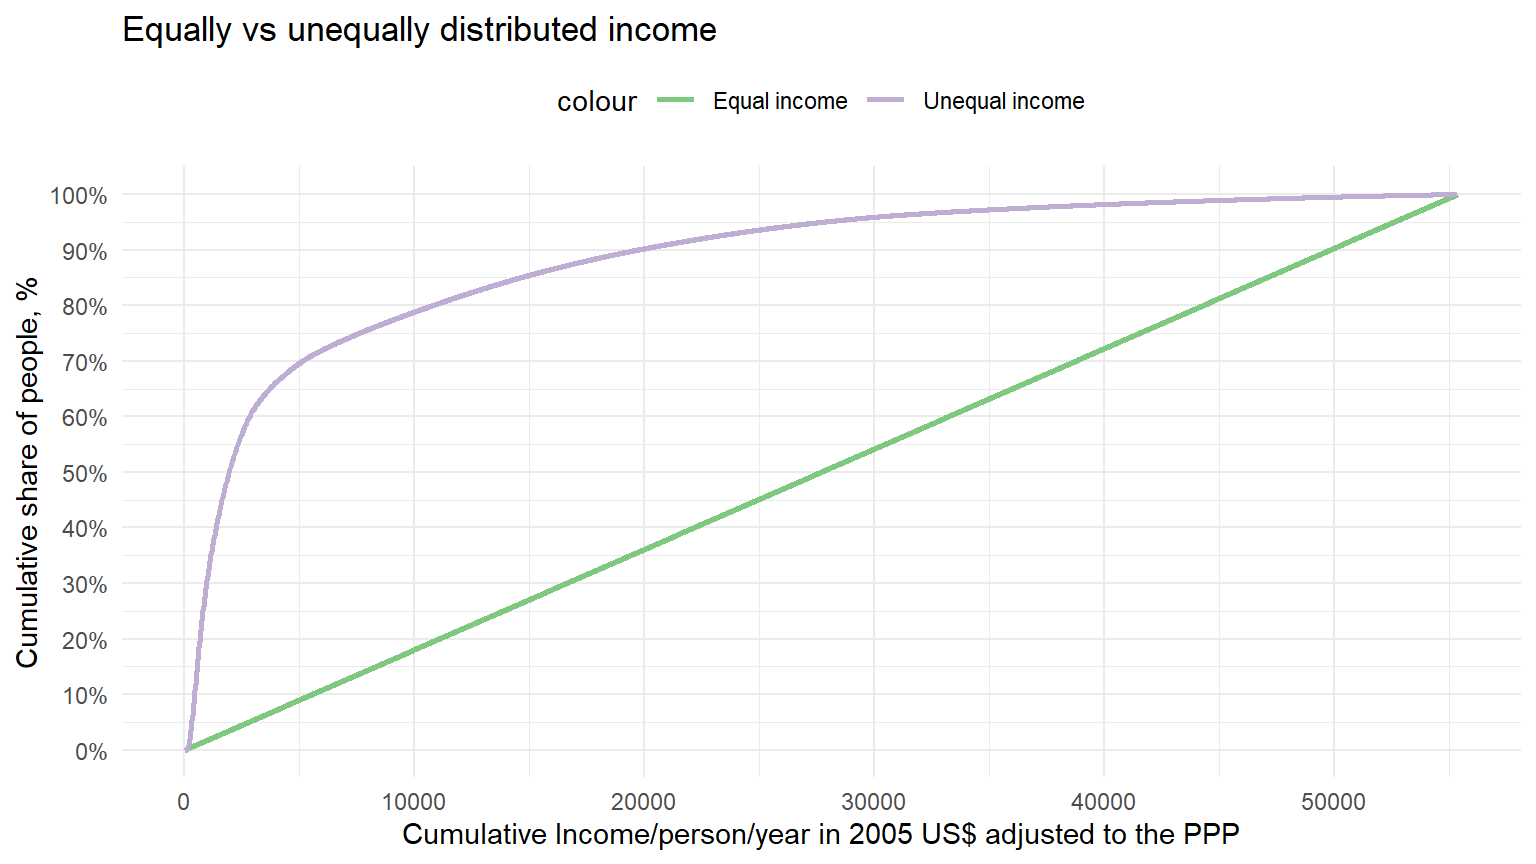
Lorenz curve
The Lorenz curve:
Is a cumulative distribution
Arrange all individuals by increasing income
- from 0% to 100% of maximum income.
Compute cumulative % of people by income level (0 to 100% of all people).
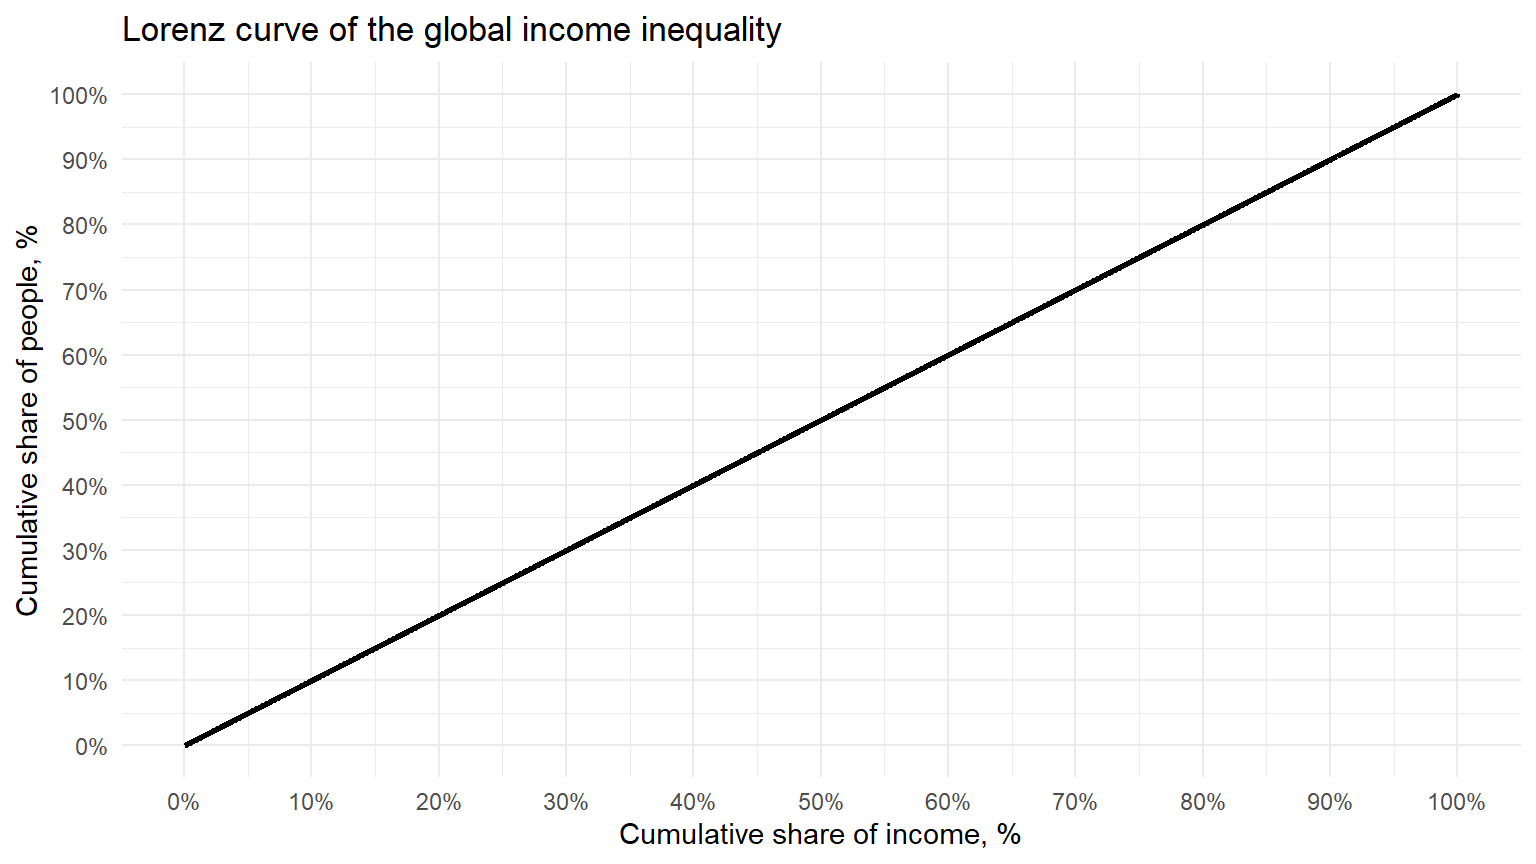
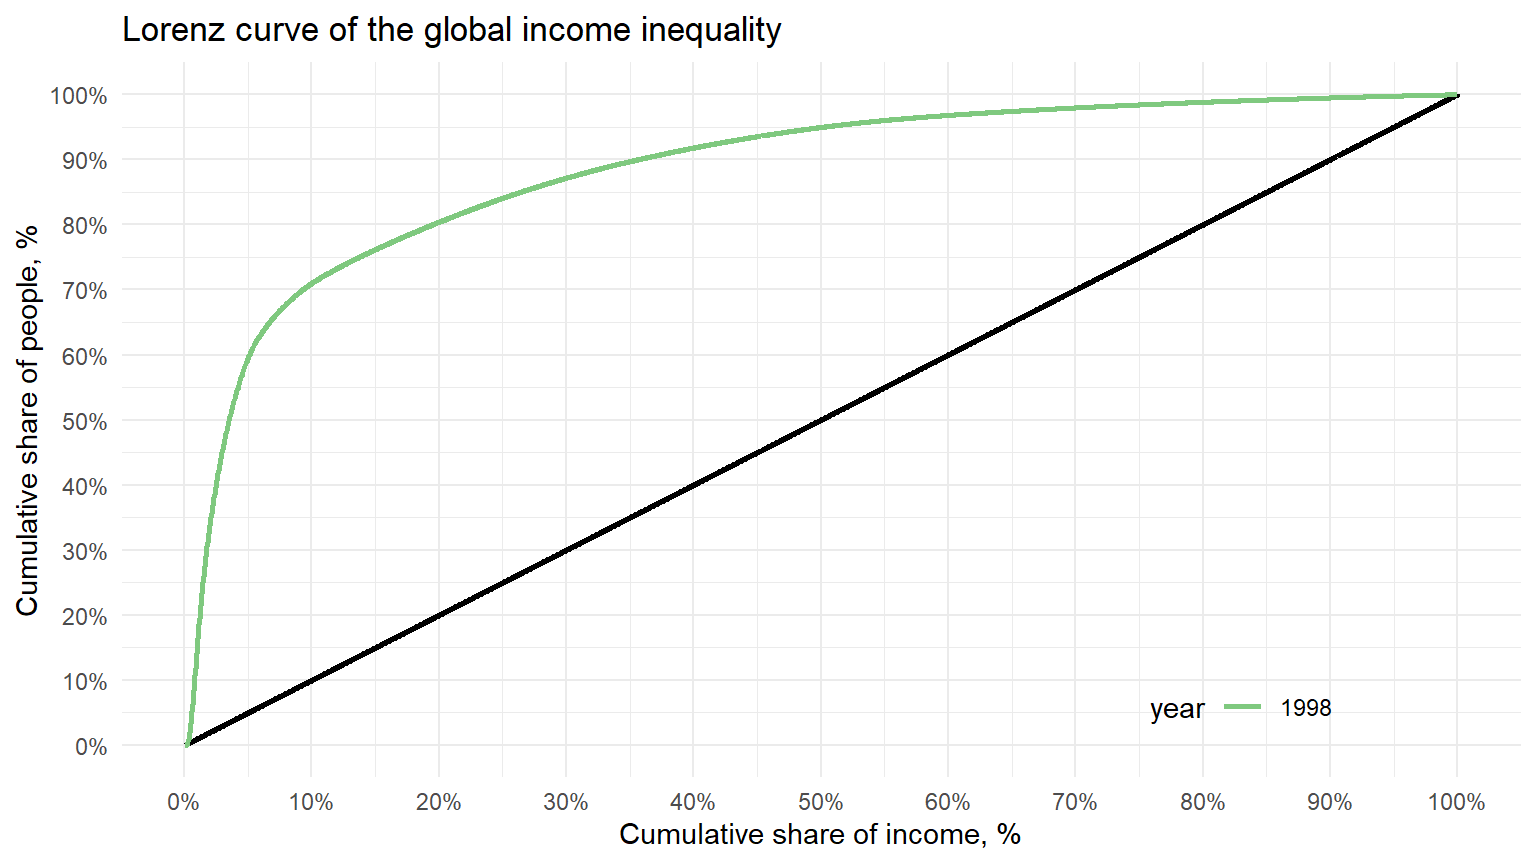
Lorenz curve: spot any differences
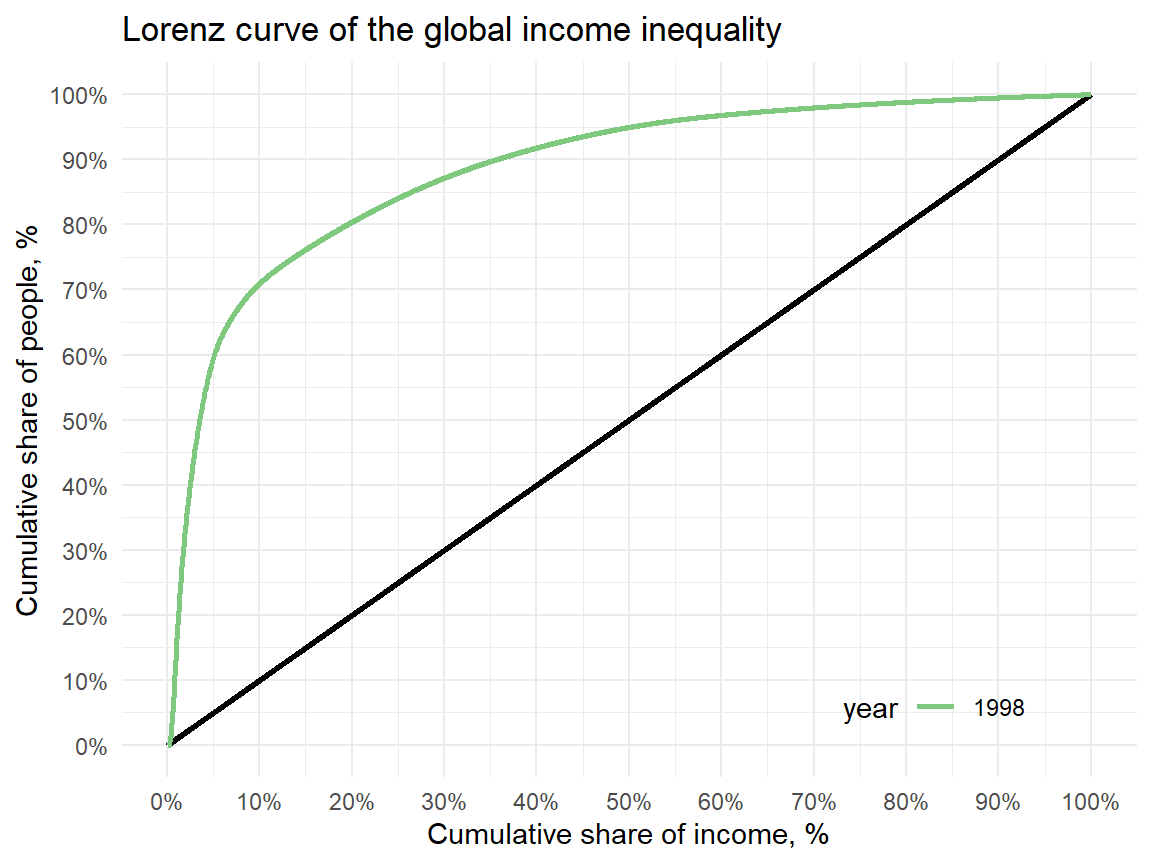
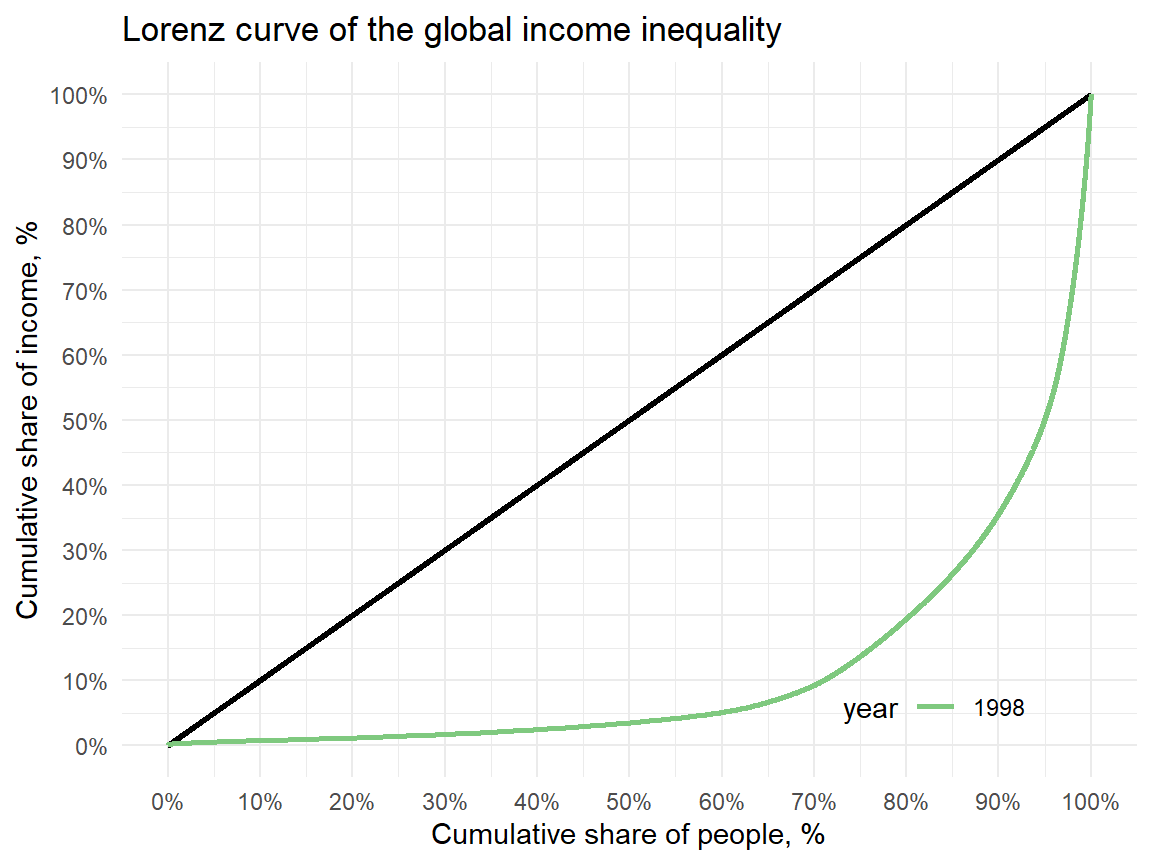
Example: Lorenz curve
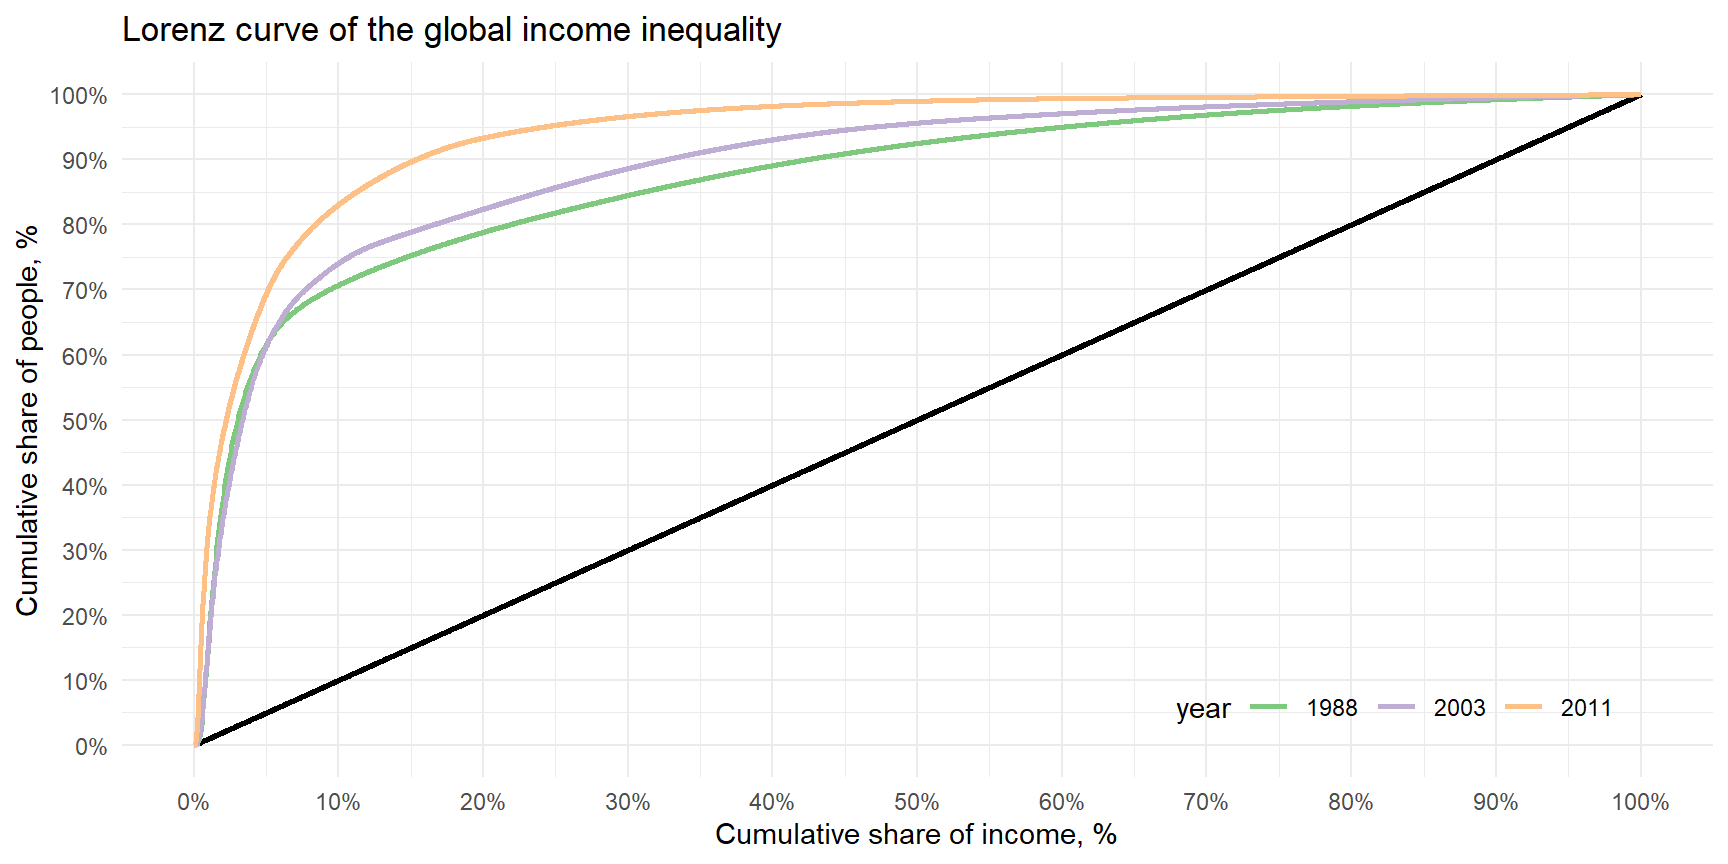
How has income distribution changed between 1988 and 2011?
What statistical concept underlies the computation of the Lorenz curve?
See also: https://ourworldindata.org/the-history-of-global-economic-inequality
Lorenz curve
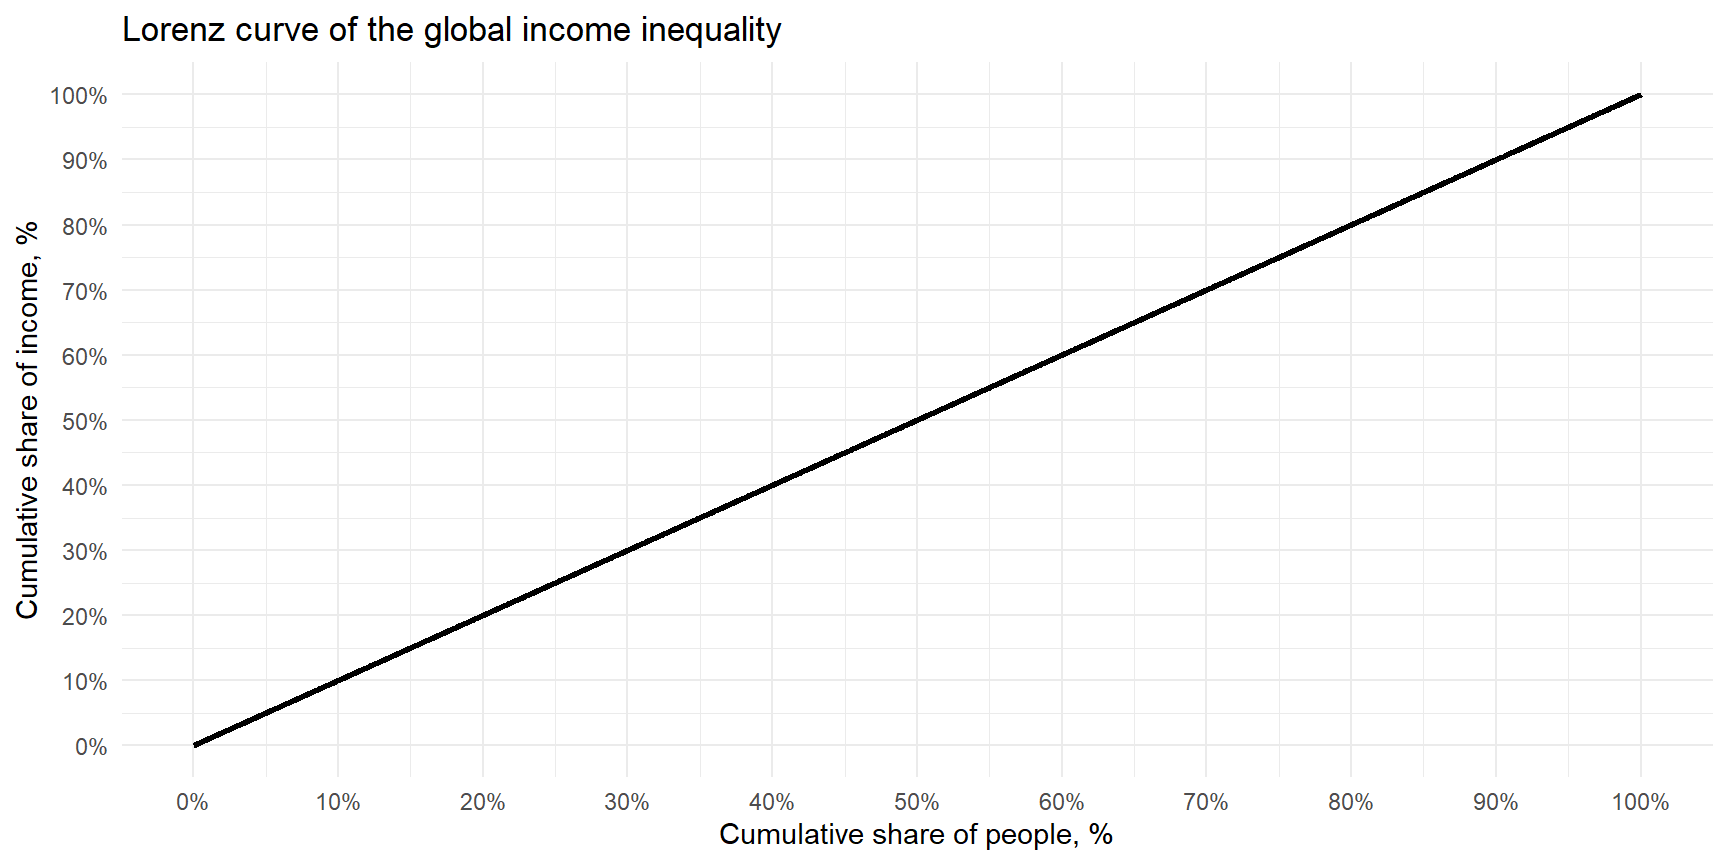
- Draw two Lorenz curves both with unequal income distribution.
- Explain differences between two curves?
At home: Lorenz curve: Inequality
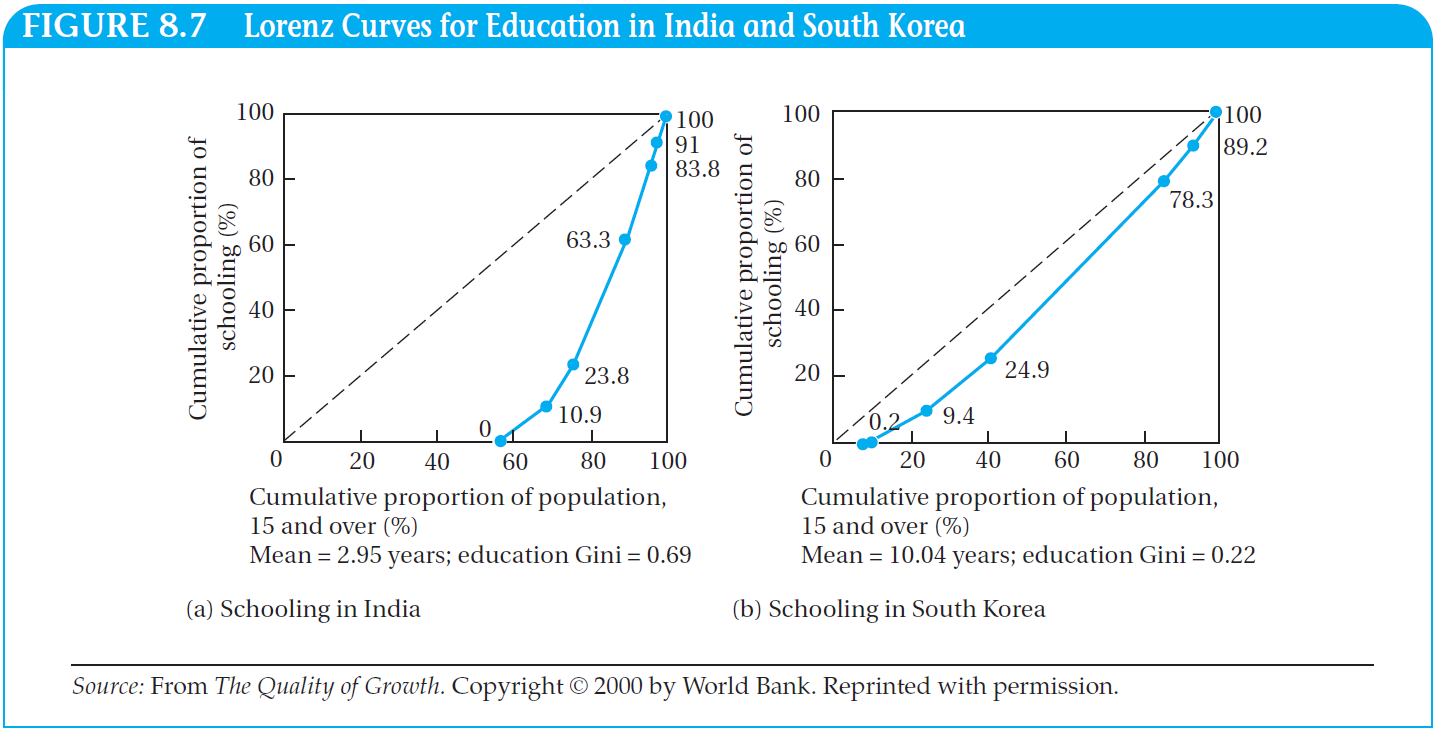
- What kind of plot is this?
- What does it show?
- Which of these two countries demonstrate more equal distribution?
- Why do you conclude this?
Todaro, Michael, and Stephen C. Smith. 2014. Economic Development. 11th ed. Pearson.
Wilke, Claus O. 2019. Fundamentals of Data Visualization: A Primer on Making Informative and Compelling Figures. O’Reilly Media.